Quick Facts
- This fact sheet highlights research published in 2010 on the annual impacts of utility-sponsored residential demand-side management (DSM) programs offered in 2007 by Gainesville Regional Utilities (GRU), a municipal utility that services residents of Alachua County, Florida.
- Annual energy savings, relative cost effectiveness, and greenhouse gas (GHG) emissions avoided were estimated for three specific energy-efficiency incentive programs: duct sealing, refrigerator buyback, and central air conditioning (A/C) system replacement.
- In the first year following upgrades and across 565 DSM participants, the three programs led to an average annual savings per household of1,476 equivalent kilowatt-hours (ekWh)—or 7% less energy consumed, $229 in reduced utility bills, and 2,714 lbs of carbon dioxide equivalent (CO2e) GHG emissions avoided.
- Across the three programs evaluated, the refrigerator buyback was the most cost effective when measured in terms of energy savings per rebate dollar invested (5.5% savings @ 12.8 kWh/$), followed by the central A/C system replacement (12.6% savings @ 5.1 kWh/$) and finally, the duct sealing (5.1% savings @ 3.0 kWh/$).
- While relatively narrow in geographic and analytical scope, this case study and research findings highlight the potential energy, financial, and environmental benefits of Florida’s utility-sponsored efficiency incentive programs.
Introduction
Utility companies provide services such as electricity, natural gas, water, and telecommunications to residential, commercial, and industrial end users. Although a utility’s ultimate function is to provide reliable utility services, these companies often offer additional programs to help customers better manage their utility use at home or workplace and thereby reduce their monthly bills.
One such approach used by electric utilities is home energy-efficiency rebate programs, a form of demand-side management (DSM). Through a variety of financial incentives and consumer education, DSM seeks to reduce the amount of energy consumed, particularly during peak hours. DSM programs can help utilities and consumers save money and better manage precious resources while delivering functionally equivalent end-use performance in categories such as lighting, refrigeration, appliances, water heating, or space conditioning.
Though this case study focuses on rebate programs offered by a Florida municipal utility, DSM also includes other techniques such as demand response, thermal energy storage, time of use incentives, distributed generation and demand-side renewables. It is also important to note that while this case study evaluates program energy savings and related utility bill and greenhouse gas (GHG) emissions reductions, DSM can also reduce peak energy demand, which is particularly important for electric utilities.[1] Finally, the emerging Smart Grid will play an increasing role in the future of DSM.
Case Study Background
Gainesville Regional Utilities (GRU) is a municipally owned utility providing electricity, natural gas, water, and other services to customers in the Alachua County, Florida region. Through its DSM programs, GRU offers a mix of rebates and incentives to promote energy efficiency. Rebates have covered activities ranging from simple equipment maintenance to whole systems approaches like GRU’s award-winning[2] “Home Performance with ENERGY STAR®” program.[3]
In 2010, researchers at the University of Florida evaluated the performance[4] of three GRU home energy efficiency rebate DSM programs (described below) and estimated the corresponding GHG emissions[5] avoided. Note that these specific GRU incentive programs were discontinued in 2013.[6]
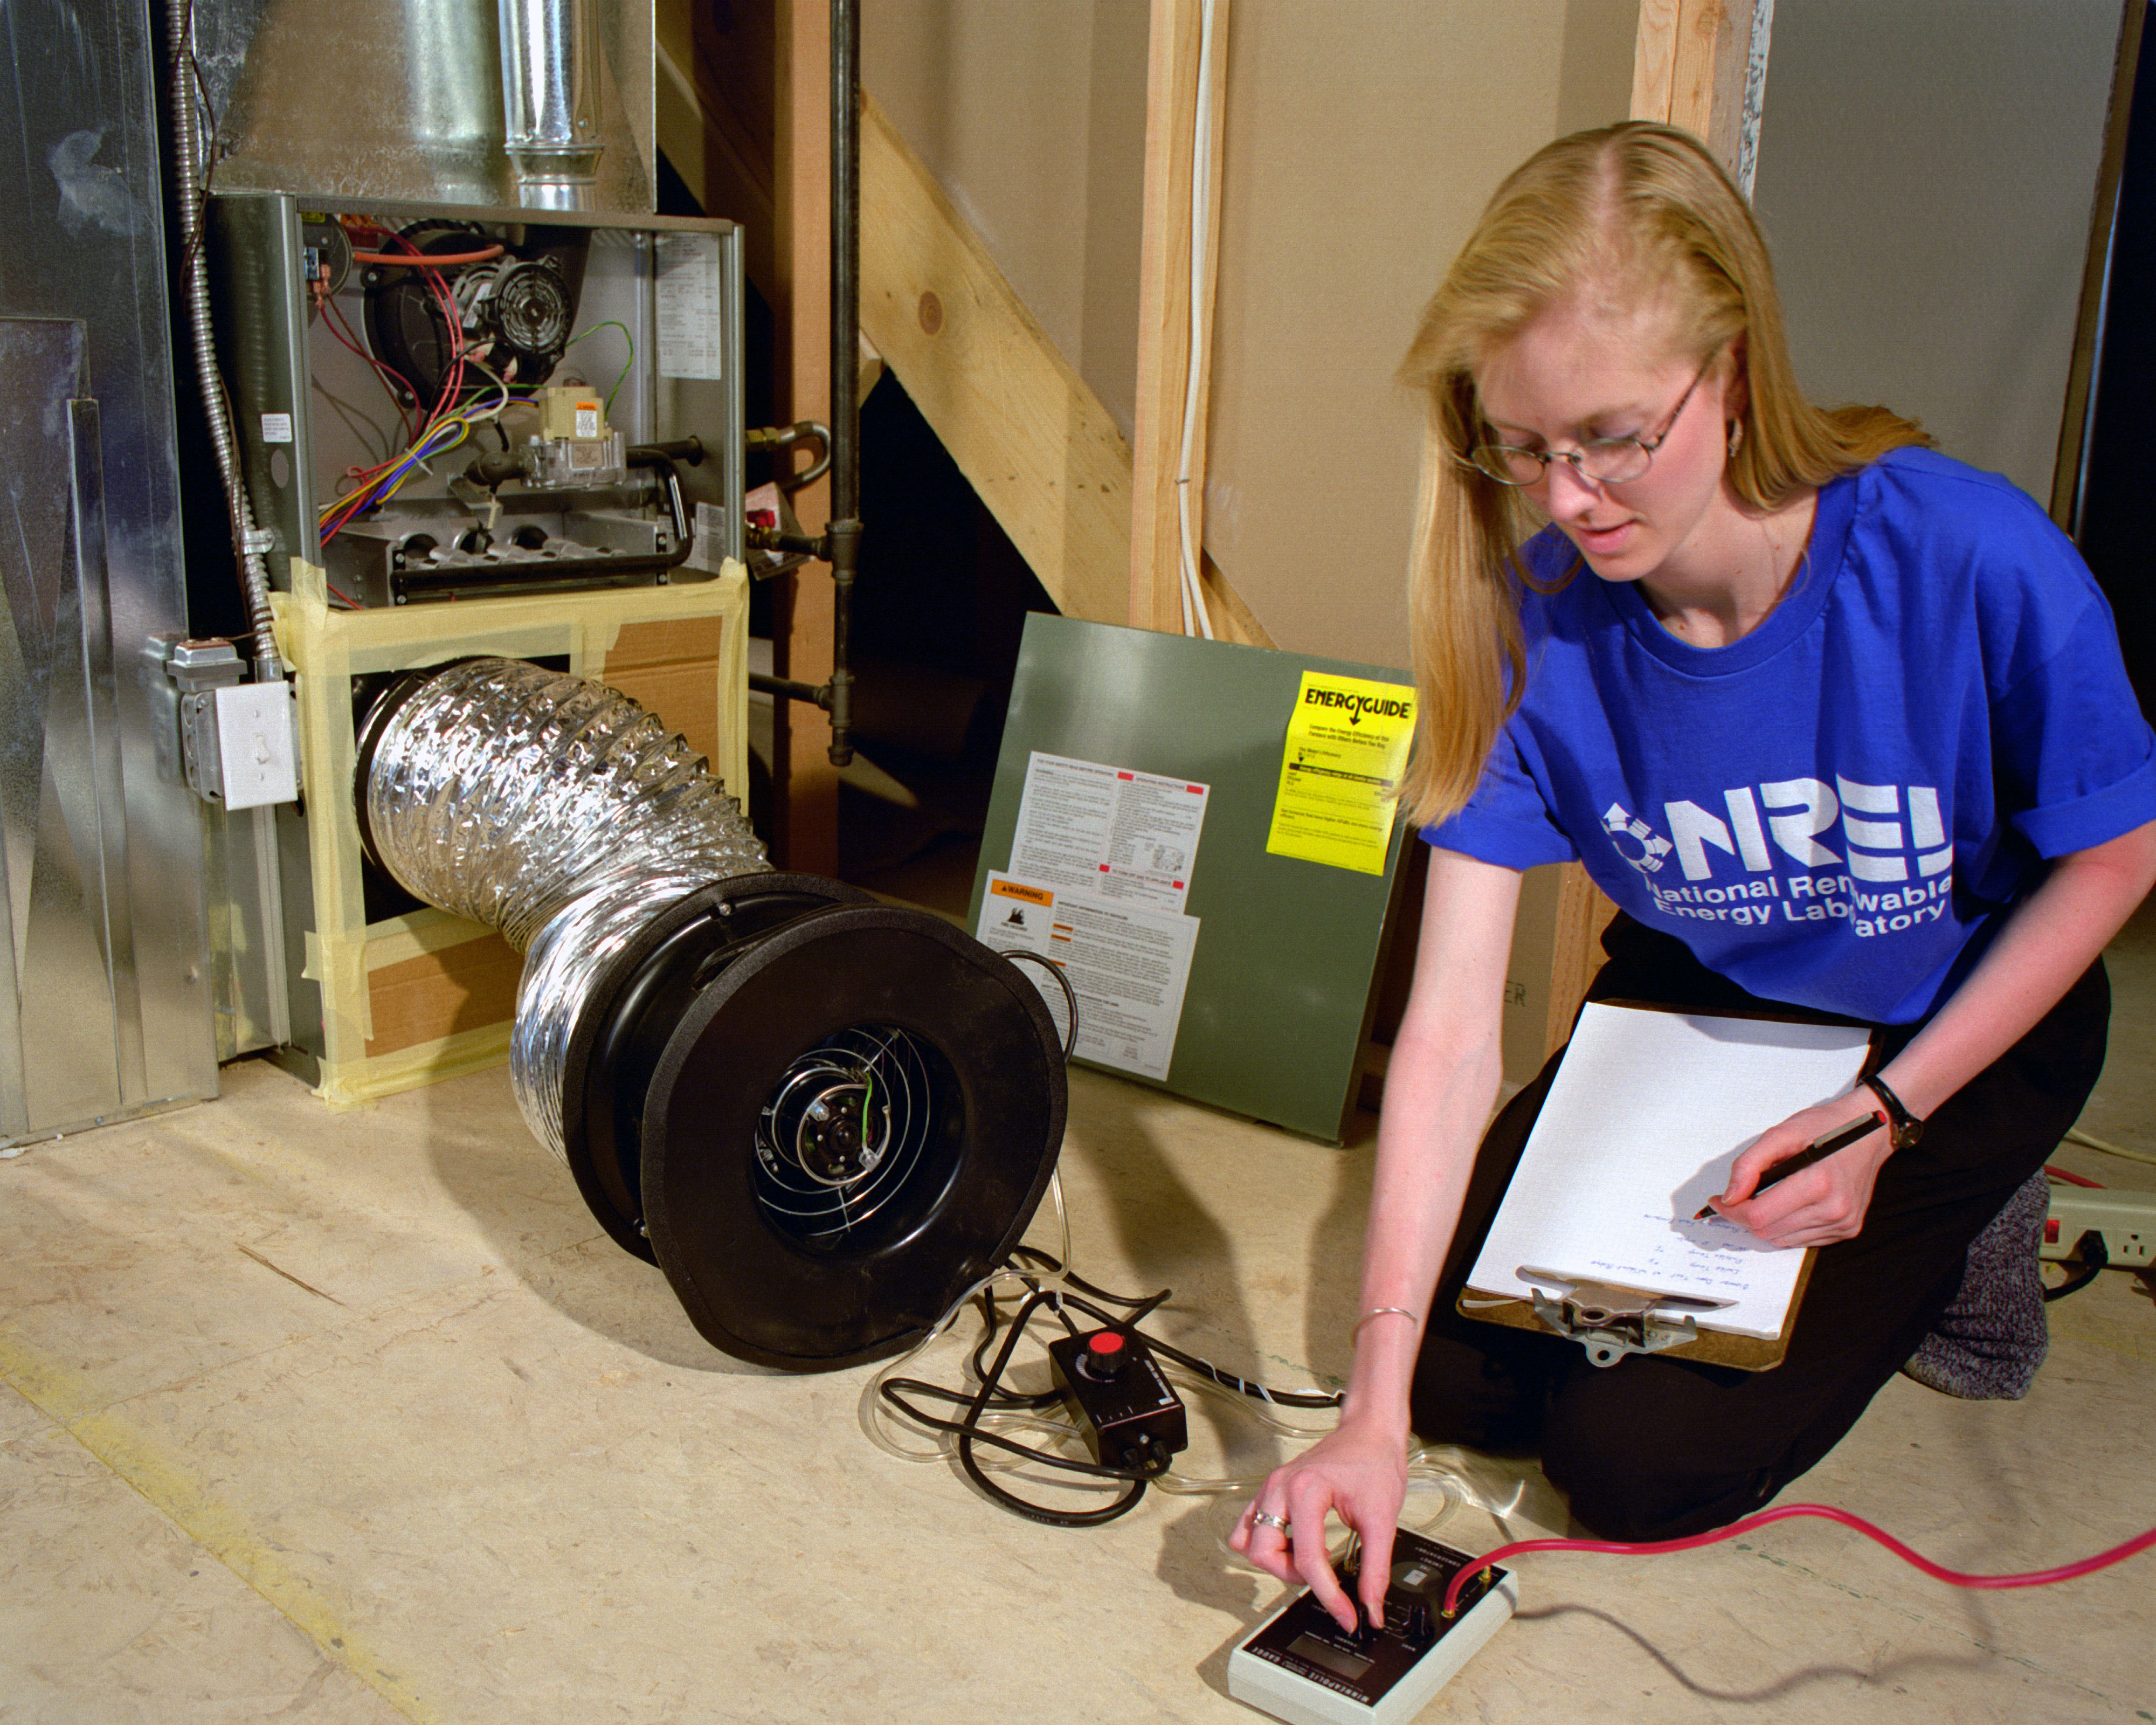
Figure 1. National Renewable Energy Laboratory staff member Sara Farrar conducts a duct blaster test to evaluate the duct leakage rate. [Click image for full size version.] (Credit: Warren Gretz / NREL 04913)
- Duct Leak Repair (up to $375 rebate): Encouraged the testing (Figure 1) and repair (Figure 2) of leaks in ductwork joints, boots, and around air handlers in order to reduce the loss of conditioned air into attics, reduce the introduction of hot humid outdoor air into homes, and correct negative pressure differentials that can result from duct leaks.
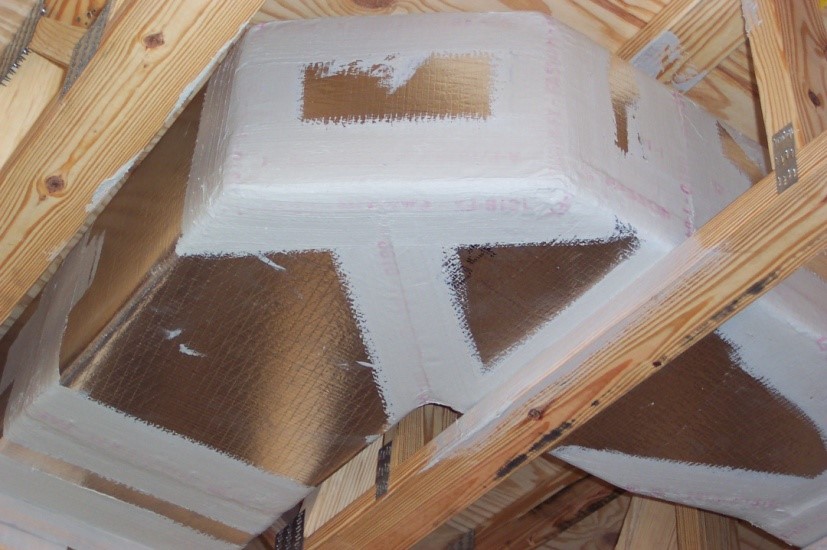
Figure 2. Mastic-sealed insulated ductwork located inside of an insulated plenum. [Click image for full size version.] (Credit: PREC)
- Refrigerator Buyback and Recycling ($75 rebate): Encouraged the removal of older, less efficient secondary refrigerators and freezers, especially those located in unconditioned spaces or moved into back-up duty when a new unit was purchased.
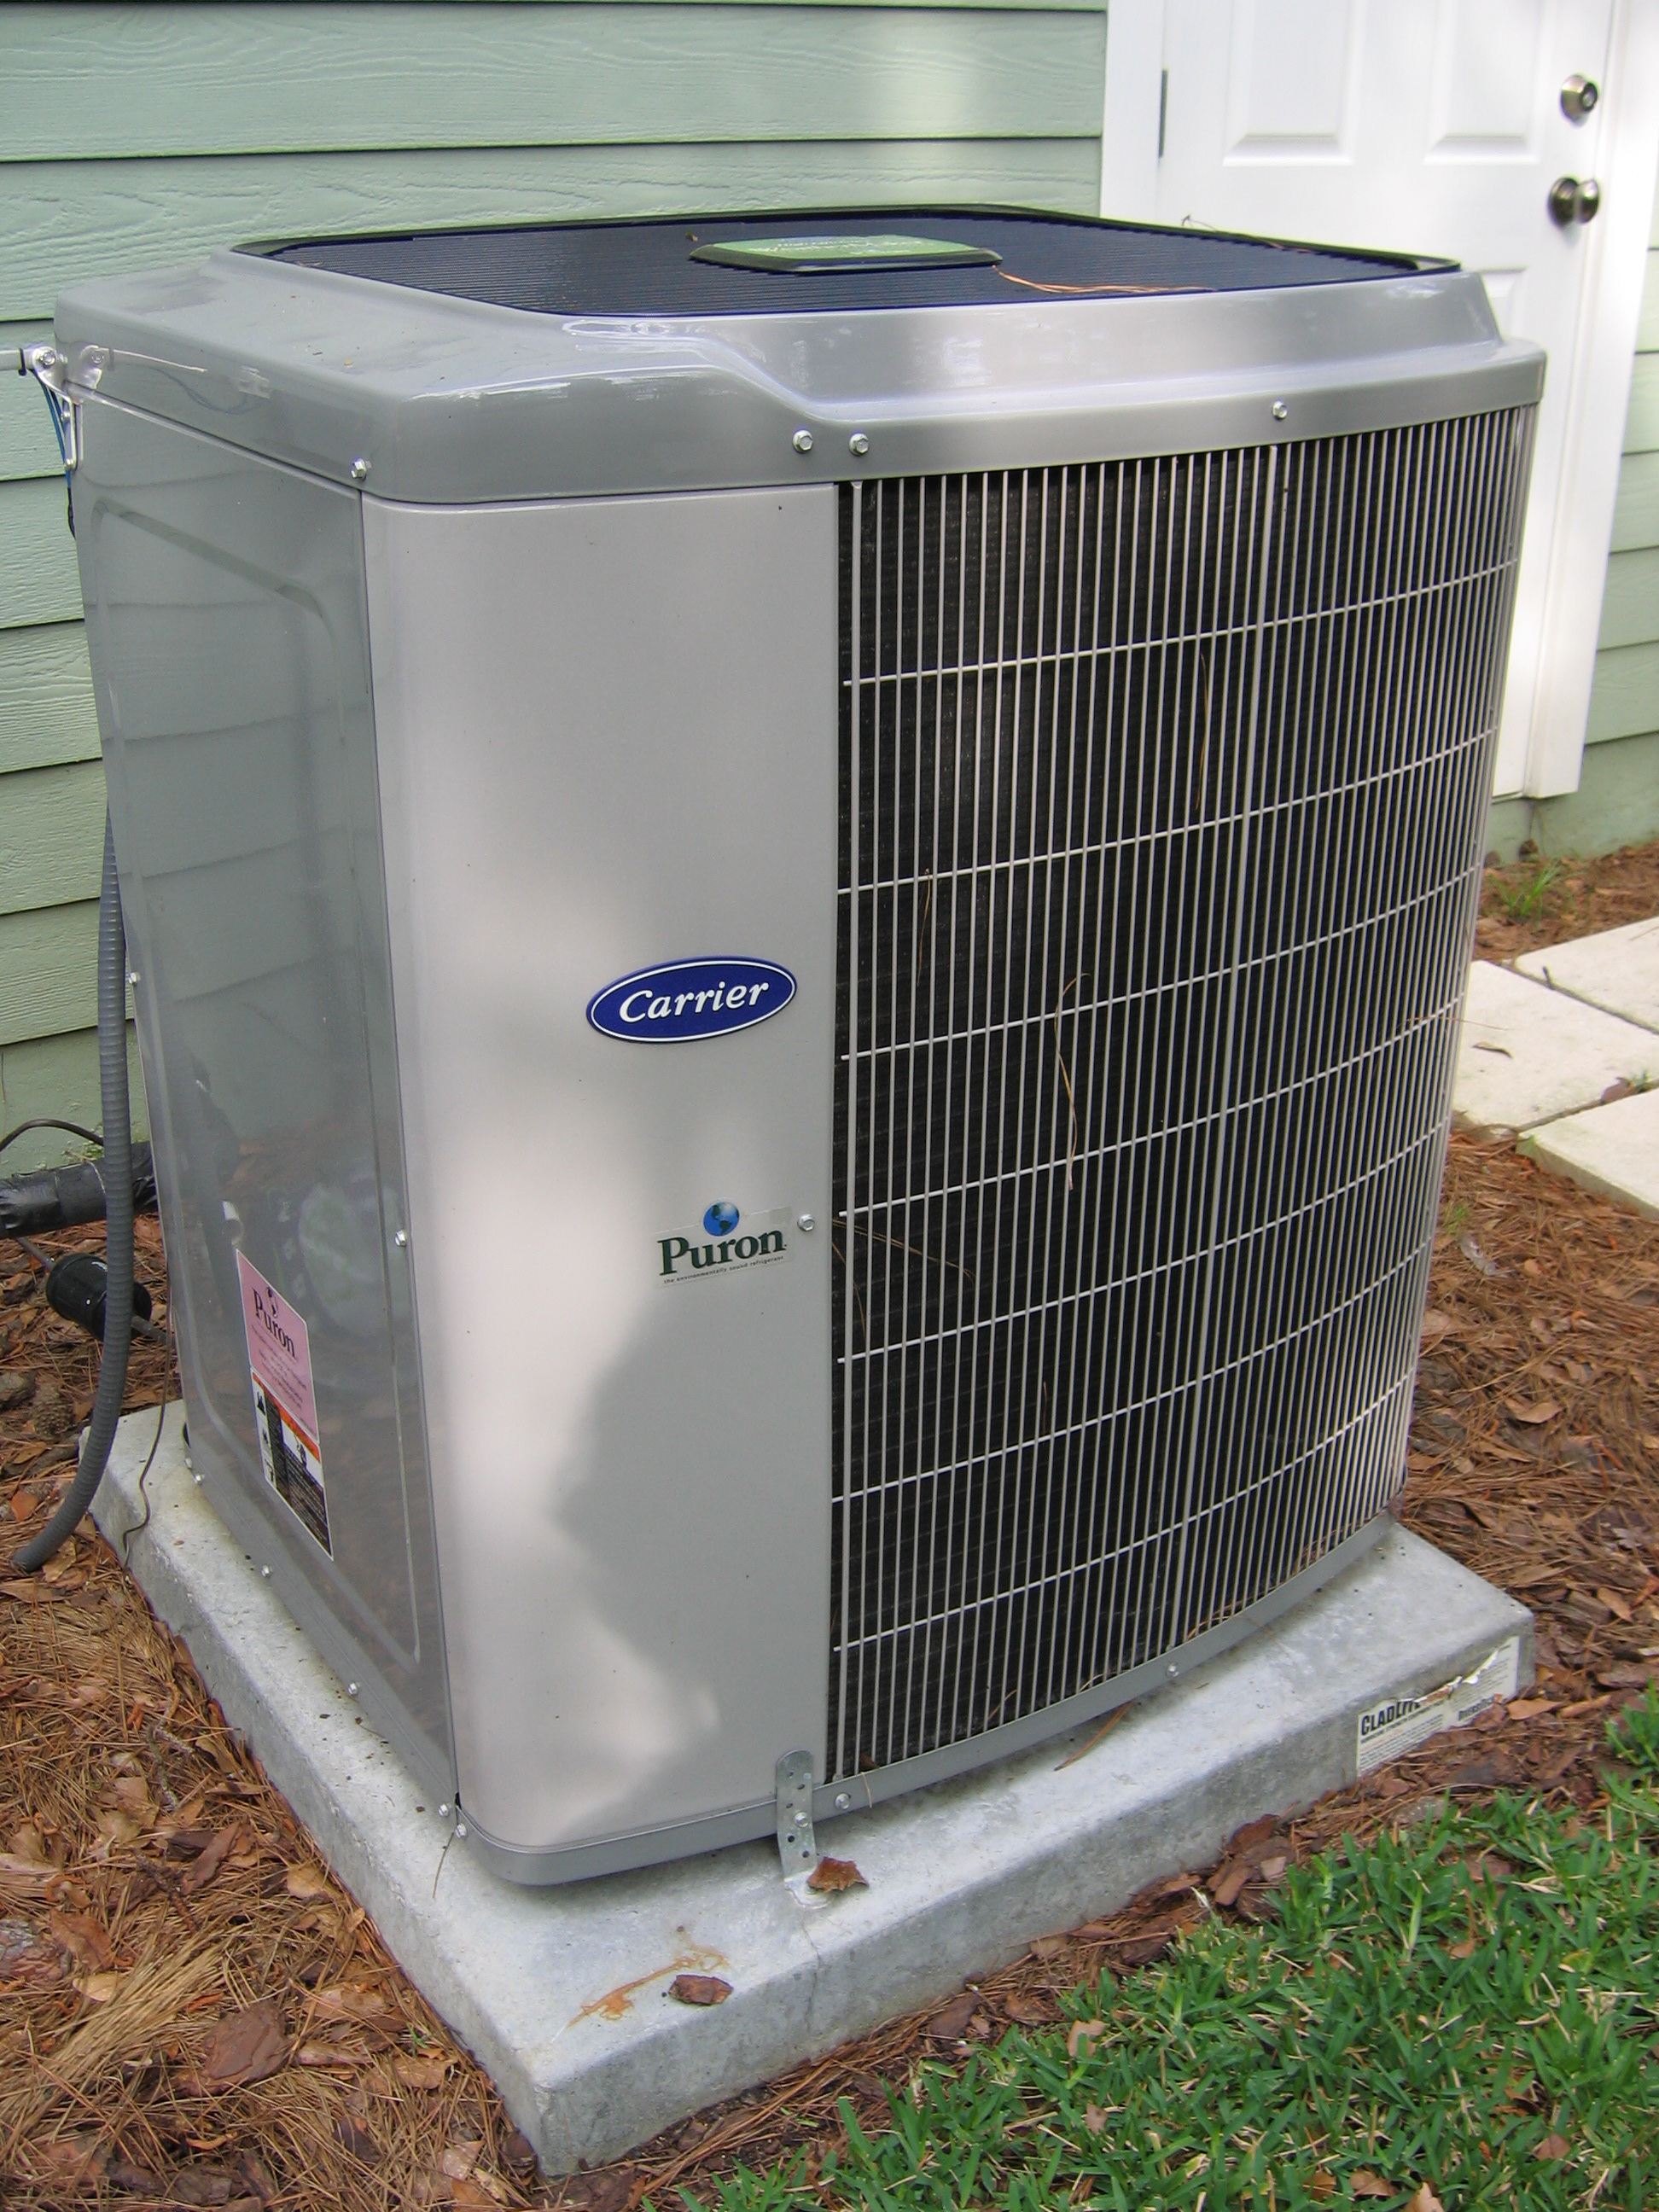
Figure 3. High-efficiency (SEER 16) air conditioner compressor unit. [Click image for full size version.] (Credit: PREC)
- High Efficiency Central Air Conditioner (up to $550 rebate): Encouraged homeowners to replace old, low efficiency or code-minimum heating, ventilating, and air conditioning (HVAC) systems with new, high efficiency units with a seasonal energy efficiency ratio (SEER) rating of 15 or higher (Figure 3). At the time these programs were offered, code only required 13-SEER HVAC systems for most new residential installations.[7]
Analysis Methods
Impacts of the three aforementioned GRU DSM programs were assessed for 565 GRU households that voluntarily participated in one (and only one) of the three programs, making qualifying home energy-efficiency improvements during calendar year 2007. For each program, we estimated annual energy savings, utility bill savings, and GHG emissions following rebate participation. The cost effectiveness of rebate incentives was also calculated as energy saved per rebate dollar invested.[8] Program outcomes and impacts are reported as averages per home (DSM participant) and, where appropriate, as combined program totals (aggregates) and overall program averages (per home).
Annual household energy consumption (combined electricity and natural gas)[9] for the year prior to improvements (2006) was compared to consumption in the first two years (2008 and 2009) following the efficiency upgrades to estimate energy savings from DSM programs. Variability in weather, behavior, and other major factors affecting energy use was controlled by applying the Annual Community Baselines methodology to measure household energy performance and program impacts. This method uses metered consumption data for all homes in a service utility area merged with property appraiser data to construct a statistical model that generates normalized measures of baseline performance for every home. Then, using DSM program participation data, the “difference of the differences” in participant and non-participant[10] “baseline performance” levels before and after efficiency improvements are compared to estimate program impacts (absolute ekWh and percent energy savings) and statistical significance.[11] We then extrapolated from energy bill savings to calculate utility bills savings[12] and avoided GHG emissions[13].
Results
Detailed results of the energy savings and GHG emissions analysis are shown in Table 1. During the first full calendar year post retrofit (2008) the three GRU DSM programs—in aggregate—reduced residential household energy use by 834,002 ekWh, enough to power approximately 40 typical GRU homes each year![14] Furthermore, incentive programs and associated qualifying home energy-efficiency measures reduced participants’ average—per home—annual energy consumption, utility bills, and associated GHG emissions. Specifically, participating households saved an average of 1,476 ekWh (7.3%) over the course of the year following improvements and reduced their annual energy bills by an average of $229. As a result, we estimate that the three DSM programs led to an average GHG emissions reduction of 2,714 lbs CO2e per home. For GRU, this equates to an average first-year energy savings of 5.6 kWh per rebate dollar invested and aggregate GHG emissions avoided of over 1.5 million lbs (696 metric tons) CO2e.
At the individual program level, the central A/C replacement generated the greatest impacts per home, with 148 participants averaging 2,786 ekWh (12.6%) in energy savings, $432 in annual bill savings, and 5,123 lbs of GHG emissions avoided. Yet the duct sealing and refrigerator buyback programs were also effective in terms of producing measurable and statistically significant results. In 2008, duct sealing improvements led to average annual savings of 1,136 ekWh (5.1%) in energy and $176 in utility bills per home. Refrigerator buybacks led to average annual savings of 959 ekWh (5.5%) in energy and $149 in utility bills per home. The refrigerator buyback program was the most cost effective in the first year, saving an average of 12.8 kWh per rebate dollar invested ($75 rebate). This was more than quadruple the benefit to cost ratios of the duct sealing—3.0 kWh per rebate dollar invested ($375 rebate), and more than double that of the A/C replacement—5.1 kWh per rebate dollar invested ($550 rebate).
Table 1. First-year impacts of three GRU energy-efficiency rebate programs: participant energy savings, bill savings and GHG emissions avoided.
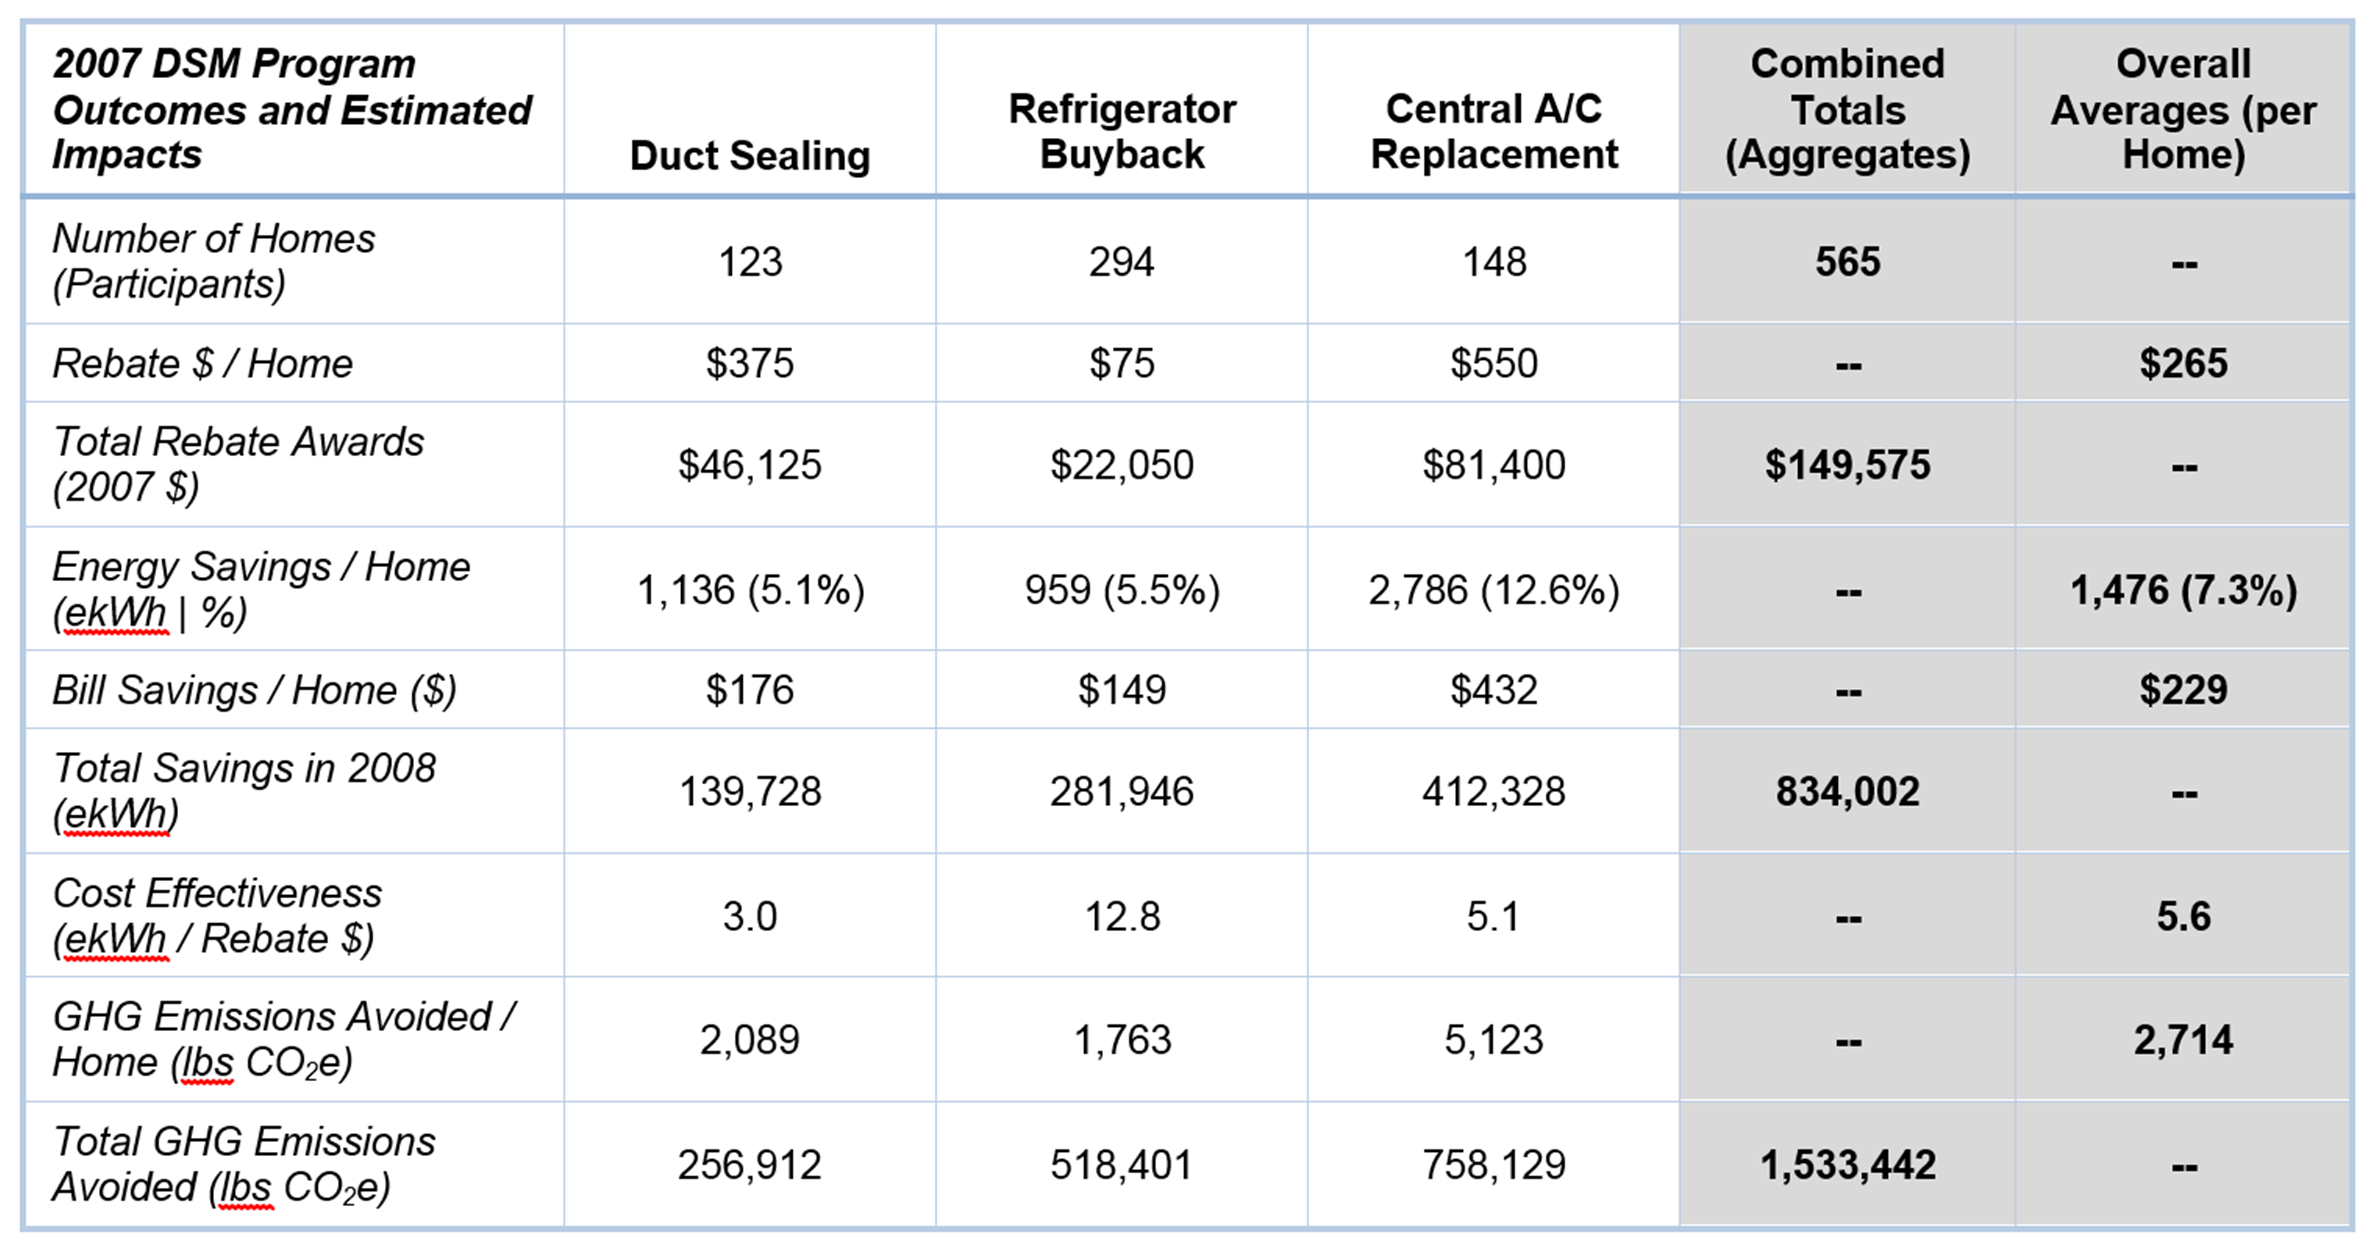
[Click image for full size version.]
Conclusions
While relatively narrow in geographic and analytical scope, this case study and research findings highlight the potential energy, financial, and environmental benefits of Florida’s utility-sponsored efficiency incentive programs. Though home energy-efficiency DSM program efficacy, much like green building program efficacy, is often judged by models of performance and theoretical energy consumption, this study uses a comparative baseline analysis of actual metered consumption and concludes that savings are both possible and measurable. If the utility can help participants maintain this improved energy-efficiency performance in future years, the benefits of energy savings and associated GHG emissions reductions may continue to accrue over each measure’s life expectancy with minimal to no added investment beyond the initial rebate awards.[15]
However, it can be difficult to maintain performance gains over time and challenging to measure actual program impacts with confidence. For example, in calendar year 2009 the consumption reductions for two of the three GRU programs appear to have degraded from those in 2008 for the duct sealing participants (declining from 1,136 to 572 kWh)[16] and the A/C replacement participants (declining from 2,786 to 2,191 kWh).[17] However, the 2009 consumption reductions improved from those in 2008 for the refrigerator buyback participants (increasing from 959 to 1,220 kWh). Explanations for these divergences between years can be difficult to identify. The more time that passes from the original point of the retrofit, the more that each household being measured may be making unknown changes to their lifestyle including adding, removing, or replacing other appliances and building systems or changing household behaviors. This confounds the results and further degrades confidence in knowing if, and to what degree, the retrofit is responsible for the savings versus some other factor(s).
The refrigerator buyback incentive, the most cost effective of the three programs, was designed to remove old, unnecessary, little used secondary refrigerators from homes (in other words, it was not a replacement program). Because of this, the refrigerator buyback rebate program required no added investment by participants, unlike the moderate investment in duct sealing and the expensive investment in A/C replacement required for participation in the other rebates. This might suggest that paying homeowners to use less energy via the removal of expendable energy consuming appliances and/or through conservation behaviors is a feasible strategy for utilities to reduce electricity demand.
Additional Resources
- Florida Department of Agriculture and Consumer Services (FDACS). 2015. My Florida Home Energy: Air Conditioning.
- Florida Department of Agriculture and Consumer Services (FDACS). 2015. My Florida Home Energy: Duct Systems.
- Florida Department of Agriculture and Consumer Services (FDACS). 2015. My Florida Home Energy: Incentives.
- Florida Department of Agriculture and Consumer Services (FDACS). 2015. My Florida Home Energy: Refrigerators and Freezers.
- Gainesville Regional Utilities. 2015. Rebates and Incentives for Homes.
- International Energy Agency (IEA). 2015. IEA Demand Side Management Programme.
- Oak Ridge National Laboratory (ORNL). n/d. Electric Utilities and Energy Efficiency.
- S. Department of Energy (DOE) Office of Energy Efficiency & Renewable Energy (EERE). 2015. Database of State Incentives for Renewables & Efficiency (DSIRE).
Acknowledgements
Authors: Hal S. Knowles, IIIa, Jennison Kipp Searcya, and Nicholas W. Taylora
Reviewers: Tom Grossb (2011), Julie Harringtonc (2011), Mark Isaacd (2011), Ted Kurye (2011), and Michael Ohlsenf (2011)
a Program for Resource Efficient Communities, Florida Cooperative Extension Service, Institute of Food and Agricultural Sciences, University of Florida, Gainesville, FL.
b Strategic Planning, Orlando Utilities Commission (OUC), Orlando, FL.
c Center for Economic Forecasting and Analysis, The Florida State University, Tallahassee, FL.
d Department of Economics, The Florida State University, Tallahassee, FL.
e Public Utility Research Center, Warrington College of Business Administration, University of Florida, Gainesville, FL.
f Energy Services, City of Tallahassee, Tallahassee, FL.
Bill Shepherd, Energy and Business Services Manager, Gainesville Regional Utilities, provided DSM program data for this case study. GRU staff provided the 2008 GHG emissions intensity.
First published February 2011. Revised June 2015.
This fact sheet was originally produced as part of the Carbon Challenge Series for the Florida Energy Systems Consortium. The goal of the consortium is to become a world leader in energy research, education, technology, and energy systems analysis.
Footnotes
[1] For example, typically the generation costs of electricity during peak demand periods is the most expensive due to the type of generation technologies, the costs of the fuel, and the need for this peak generation to be accessible in very rapid time responses.
[2] U.S. Environmental Protection Agency (EPA). n/d. Gainesville Regional Utilities (GRU) Gainesville, Florida: ENERGY STAR Partner of the Year. Retrieved June 10, 2015.
[3] U.S. Environmental Protection Agency (EPA). n/d. ENERGY STAR: Energy Savings at Home. Retrieved June 10, 2015.
[4] Jones, P. H., Taylor, N. W., Kipp, M. J., and Knowles, H. S. (2010). Quantifying Household Energy Performance Using Annual Community Baselines. International Journal of Energy Sector Management: Vol. 4 No. 4, pp.593–613.
[5] Reported as carbon dioxide equivalents (CO2e), which are calculated by converting all relevant GHG emissions (e.g., carbon dioxide, methane, and nitrous oxide most commonly) for that emissions source into the common unit of carbon dioxide emissions (i.e., equivalencies) using their individual global warming potentials (GWP) as conversion factors.
[6] GRU’s current residential rebate programs are posted online at GRU: Rebates and Incentives for Homes.
[7] International Code Council (ICC). 2007 Florida Building Code including 2009 Supplements, Section N1108.AB.3: Equipment performance standards.
[8] There are more complex and sophisticated approaches for measuring DSM program cost effectiveness, an explanation of which is beyond the scope of this fact sheet. We include these gross measures of cost effectiveness here to highlight the relative benefits (energy savings) and costs (rebate $) across the three DSM programs.
[9] Natural gas consumption (in therms) was converted into kWh equivalent (ekWh) to normalize total household energy consumption into common units.
[10] In this case, over 22,000 non-participant households were included in the model to normalize baseline performance and estimate program participant savings.
[11] Jones, P. H., Taylor, N. W., Kipp, M. J., and Knowles, H. S. (2010). Quantifying Household Energy Performance Using Annual Community Baselines. International Journal of Energy Sector Management: Vol. 4 No. 4, pp.593–613.
[12] Assumed $0.155/kWh for GRU using Tier 3 rate at $0.1020 plus Fuel Adjustment Rate at $0.0530 as of November 2010. Actual dollar savings per kWh saved varies across households according to their total monthly consumption, rate structure, time of year, fuel surcharges, and/or other circumstances.
[13] For the year 2008, GRU’s GHG emissions intensity was 1.8387 lb CO2e/kWh or 0.834 MtCO2e per MWh. This number was provided by GRU staff and took into account GRU’s complete fuel mix at the time, including native GRU owned generating units, power purchased from other utilities, and GRU’s respective ownership share of Progress Energy of Florida’s Crystal River Nuclear Power Plant. Note: This more specific GHG emissions intensity per kWh for GRU’s detailed fuel mix is slightly less than the intensity archived in the U.S. EPA eGRID 2005 data. Aggregate GHG emissions avoided as reported may vary from “Per Home” × “Number of Homes” due to rounding differences.
[14] Assumes 2,000 square foot average house size consuming GRU’s combined average household energy budget of 10,244 ekWh per 1,000 square feet of home size from the years 2006 through 2009.
[15] Behavioral science research suggests a small investment in periodic “prompts” or other reminders like an annual postcard for each household and feedback about how their home performance compares to their peers may help to ensure performance results persist. For readers interested in learning more about the persistence of energy-efficiency interventions, see Alcott (2005), Abrahamse et al. (2005), and Abrahamse et al. (2007).
[16] The second-year (2009) results were not statistically significant, as reported in Jones et al. (2010).
[17] As reported in Jones et al. (2010).