Introduction
Regulatory policies can sometimes be confusing, especially when they are designed to manage complex environmental issues such as climate change. So before explaining the particulars of carbon cap and trade policy, let’s begin with a more simplistic hypothetical example.
Imagine walking into your local gym and being told that a water shortage is requiring the gym owners to monitor and manage gym member water use. What strategies might the gym owners use to keep water use down? How might you behave under each option?
Maybe the owners would simply place a surcharge on every gallon of water used for showering, hand washing, toilet flushing, and refilling your water bottle at the fountain. This water tax might raise money for the gym owners, but would it reduce water use?
Maybe the owners would develop a scheme that places a maximum limit on the total amount of water used by the entire gym each month and provides incentives for efficient users and penalties for wasteful users to keep overall usage within the limit. What if the scheme creates a series of water allowances for each member based on their gym attendance? What if the owners keep a tally on usage for each member and allow efficient members and those who rarely visited the gym to trade their allowances to those who use more water? This cap and trade scheme might keep water use within the capped limits, but would it be too complex to manage?
For these two options and other alternatives, the devil is likely in the details. Though this hypothetical example used a water shortage as the natural resource being managed, governments at local, state, federal, and international scales use similar approaches to manage both resource usage as well as environmental pollution. There are both positive and negative implications to any regulatory policy.
Without comparing and contrasting policies, this fact sheet provides a brief overview of the carbon cap and trade scheme, one of the most commonly discussed options for a greenhouse gas (GHG) emissions reduction program for the United States. As energy production and consumption is a significant driver of climate change, a carbon cap and trade policy might require all Americans to think about energy and its associated emissions in the same ways our gym members think about water in our hypothetical example above.
What is Carbon Cap and Trade and Who Will It Affect?
Carbon cap and trade is a performance-based policy tool that integrates mandatory GHG emissions limits (the “cap”) with saleable allowances (the “trade”). By merging pollution regulations with a market-based approach, this policy is designed to reduce GHG emissions over time. Specifically, this approach allows regulated industries to determine how best to comply with the policy. Example compliance strategies can be found in Table 1.
Table 1. Potential Marketplace Approaches within Carbon Cap and Trade
| Compliance Strategies | Benefits | Challenges |
| GHG emissions controls | Reduces emissions through improved technology to prevent and/or capture pollution at the source Often includes engineered solutions that persist in performance when properly maintained |
Often includes technologies that are high cost and slow to implement May require technological advances that do not yet exist or are not yet cost-effective |
| Efficiency and optimization measures | Reduces the carbon intensity of manufacturing a product or delivering a service Often includes engineered solutions that persist in performance when properly maintained |
May include technologies that are high cost or have large barriers to implement May require technological advances that do not yet exist or are not yet cost-effective |
| Conservation measures | Reduces the demand for a particular high carbon intensity product or service Often includes measures that are low cost and fast to implement |
Persistence of emissions reductions may degrade over time Depends on human behaviors, which can be highly variable and unpredictable |
| Purchase allowances and offsets | Allows emitters out of compliance to purchase emissions offsets to meet their cap (assumes offsets cost less than alternative compliance measures) | Measuring, monitoring, and verifying accuracy and authenticity of emissions offsets |
| Sell allowances | Allows emitters below their cap to make money selling their excess allowances | Measuring, monitoring, and verifying accuracy and authenticity of emissions offsets Hoarding behavior by emitters May require limits in the number of allowances that a single emitter can obtain |
| Bank allowances | Creates flexibility for emitter as to how allowances can be used in the future | Anticipating value of selling allowances in a future year is uncertain and involves risk |
First published on October 30, 2009 and effective as of December 29, 2009, a United States (US) Environmental Protection Agency (EPA) rule requires all “suppliers of fossil fuels or industrial greenhouse gases, manufacturers of vehicles and engines, and facilities that emit 25,000 metric tons or more per year of GHG emissions…to submit annual reports.” [1] This rule has undergone several rounds of technical amendments and corrections and was an early step toward more complete climate change regulation and focuses on the industries contributing the largest proportion of GHG emissions in the United States. These same industries are also likely to include the point source (i.e., single origin) emitters most affected by carbon cap and trade regulation. This policy implemented by the EPA, titled the Greenhouse Gas Reporting Program (GHGRP), has been in constant effect since 2009, and publishes annual reports available here. Between 85-90% of the largest point source GHG emitters, out of the 8,000 accounted for, report to the GHGRP.
Cap and Trade: Examples from the Clean Air Markets
A carbon cap and trade program would likely be based on lessons learned from the successful Acid Rain Program (ARP) and Clean Air Interstate Rule (CAIR) within the US EPA Clean Air Markets. Established in 1990 within the Clean Air Act Amendments, the ARP manages sulfur dioxide (SO2) and nitrogen oxides (NOx), the major molecules that contribute to acid rain. Though ARP uses a more traditional “rate-based regulatory system” for NOx, the program uses a cap and trade scheme to reduce SO2 emissions. CAIR used a cap and trade scheme requiring 28 eastern states to reduce SO2 and NOx, though it was replaced by the Cross-State Air Pollution Rule (CSAPR) as of January 1, 2015. The 2012 Progress Report for CAIR and ARP stated that perfect compliance has been reported for all facilities reporting to programs.
ARP has been effective due to a combination of factors. First, the scope of the SO2 cap and trade program was fairly narrow as it applied only to electric generating utilities. Second, proven industrial and technological alternatives to reduce SO2 emissions were available, including low-emitting fuels and pollution controls. Third, companies had flexible options for how best to cost-effectively meet their emissions reduction caps.
Key Components of Cap and Trade Air Pollution Programs [2]
Three criteria that are critical to the successful design and implementation of an environmentally effective and economically efficient trading program are: (1) the cap on emissions, (2) accountability, and (3) simplicity of design and operation. [3] Successful cap and trade programs result in technological advancement, energy and GHG efficiency, and accountability for the wellbeing of the environment. A correctly-implemented cap-and trade program should not inhibit economic function and growth. Additional components would likely include the following:
- Cap establishing GHG emissions thresholds needed to result in the desired climate response.
- Phased approach, with the reduction target cap becoming more stringent over time.
- Point (and scope) of regulation determines which entities will be directly capped.
- Upstream: Allowances procured by producers and importers of fossil fuels.
- Downstream: Allowances procured by consumers of fossil fuels, in particular, large emitters of GHG such as electric utilities and major manufacturing plants.
- Allowance allocation for one or more years based on emissions history, industry sector, and other characteristics.
- Allowances can be auctioned and/or distributed for free.
- Proceeds from auction(s) can be recycled among households and/or affected industries.
- Annual reconciliation that balances allowance limits, sales, purchases, and banks.
- Allowance trading in secondary markets among emitting entities.
- Flexible compliance, giving each emitter freedom to choose the most efficient (cost, time, etc.) approach toward emissions reduction
- Includes the ability to purchase offsets from non-capped sources.
- Stringent accountability through measuring, monitoring, and verification of actual emissions and offset projects.
- Clear and enforceable penalties levied for non-compliance.
Key Benefits of Cap and Trade Air Pollution Programs
Due to the combined results of ARP and CAIR, both SO2 emissions and NOx emissions in the year 2012 were respectively 79 percent and 75 percent below their year 1990 baseline levels. By decreasing these emissions, deposition of acids in the environment decreased, ozone formation decreased, and visibility improved. One study suggests “the [human] health benefits [primarily reduced premature mortality from fine particulate matter and ground level ozone exposure] due to ARP implementation in 2010 are valued at $170-$410 billion (2008 dollars)” across the United States and these estimates “do not include human welfare benefits due to better ecological conditions, such as improved visibility and reduced acidification of lakes and streams.” [4]
In theory and based on the successes of the ARP, a functional carbon cap and trade program would help ensure lower compliance costs and lower administrative costs for both the government and industry when compared to alternative options. By design, it would reward innovation and early adoption and penalize non-compliance and failure to act. Other benefits would likely include increased transparency on GHG emissions sources (Figure 1) and their progress on reduction targets, flexibility in compliance strategies, and potential for job creation in carbon accounting, regulated emitters, and all industries offering compliance products or services.
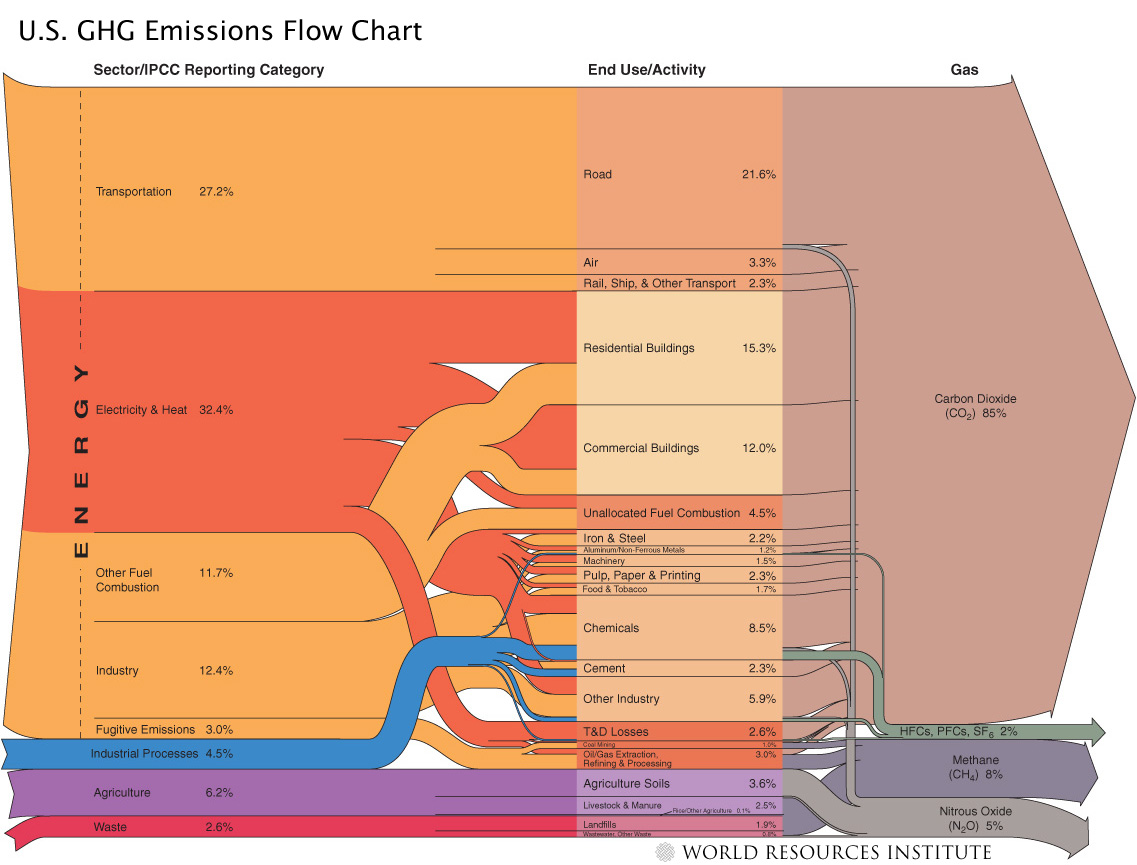
Figure 1. Major greenhouse gas (GHG) emissions sources and activities within the United States based on 1990-2003 inventory data. Energy use contributes the preponderance of GHG emissions nationally and would serve as the major industry sector regulated within a carbon cap and trade program. The most current US GHG Inventory data can be found here. Credit: World Resources Institute.
US EPA Clean Power Plan
Since June 2014, the Obama Administration and the US EPA have been collaboratively developing the Clean Power Plan, a proposed rule to set flexible standards and regulate carbon emissions nationwide. The Clean Power Plan applies to new products and service, as well as to power plants already in existence. According to the Obama Administration and the US EPA, the plan has the potential to drive the year 2030 GHG emissions to levels 30 percent below those reported in the year 2005.
General Plan Structure
The US EPA plans to specify carbon emission standards tailored to the unique fuel mixes and opportunities inherent to each state. In turn, each state will be responsible for achieving these standards by the year 2030 using strategies optimized for their local ecological, social, and economic conditions and utility fuel mixes. These strategies may include: (1) energy efficiency demand-side management (DSM) programs; (2) renewable and alternative energy portfolio standards (RPS and AEPS); (3) energy efficiency resource standards (EERS); (4) efficiency improvements at existing power plants; (5) fuel switching to natural gas or cogeneration for new and/or existing power plants; (6) improving energy storage technology; and (7) smart grid connected distributed renewables such as rooftop solar PV. After the standards are set, the states must develop, deploy, and report their plans of action for achieving these standards within the specified time frame. According to the US EPA, all initial state plans should be implemented by the year 2020.
Regional Carbon Cap and Trade Programs
Nine Northeastern states participate in the Regional Greenhouse Gas Initiative (RGGI), a cap and trade program that regulates the GHG emissions of electricity generators within a subset of the United States. Though the Western Climate Initiative (WCI, Inc.) previously designed a regional trading scheme, it was never deployed and RGGI is the first, and only, fully functioning, US-based carbon cap and trade program.
In 2008, Florida House Bill (HB) 7135 legislation was approved authorizing the development of proposed rules for a similar cap and trade program for Florida electric utilities. However, as a result of the evolving statewide political milieu and ongoing federal efforts related to the establishment of a national cap and trade policy, a final rule was not adopted in Florida.
The Clean Power Plan permits states to participate in multi-state agendas or groups, such as RGGI or WCI, for achieving GHG emissions reductions across jurisdictions. Joining such multi-state programs may lead more states to explore policy options such as cap-and-trade.
Florida Public Service Commission Load and Resource Planning
The 2012 Florida Statues, Title XIII, Chapter 186, Section 801, require electric generating facilities to submit a Ten-Year Site Plan (TYSP) to the Florida Public Service Commission (PSC). Using a ten-year horizon, these plans are reviewed and classified by the PSC as either “suitable” or “unsuitable” based on estimates for the projected power generation needs and proposed locations of new generation facilities.
As previously stated, Florida has not yet adopted an official GHG emissions reduction policy. Yet, this TYSP process may evolve to address these GHG emissions reduction goals, and Florida’s utilities already have a foundation of strategies from which we can expand. As summarized in the Review of the 2014 Ten-Year Site Plans of Florida’s Electric Utilities, existing and proposed utility demand-side management programs, regulated through the Florida Energy Efficiency and Conservation Act (FEECA), shall “reduce the system’s total summer peak demand by approximately 8,000 megawatts (MW), and annual energy consumption by over 11,000 gigawatt-hours (GWh)” by the year 2023. Furthermore, Florida’s electric utilities have planned “722 MW of additional renewable generation [beyond the 1,620 MW currently installed]…excluding any potential net metering additions [such as distributed rooftop solar PV].”
Potential Primary GHG Emissions Reduction Strategies
The Clean Power Plan emphasizes achieving GHG emissions reductions through US EPA regulated carbon pollution standards for new power plants and regulations on existing plants. Beyond the US EPA, other US Government agencies have begun taking action. For example, the National Highway Traffic Safety Administration (NHTSA) and the US EPA have issued “joint final rules” which integrate “the Corporate Average Fuel Economy (CAFE) standards under the Energy Policy and Conservation Act (EPCA)…[with the] national greenhouse gas (GHG) emissions standards under the Clean Air Act” for passenger cars and light trucks for model years 2017 through 2025.
In June 2012, the Federal Aviation Administration (FAA) issued their United States Aviation Greenhouse Gas Emissions Reduction Plan with a goal of attaining carbon-neutral growth in the aviation industry by 2020 as compared to a 2005 GHG emissions baseline. The plan aims to improve engine energy efficiency, improve operations to burn less jet fuel, research alternative fuel methods, adopt conservational policies, and subsidize scientific research on the impact of jet fuel on climate. Additionally, in January 2014, President Obama has issued a memorandum establishing the first existing Quadrennial Energy Review
Potential Hurdles & Other Policy Options
As with any performance-based policy measure, there is a risk of inaccurate measurement, over / under / double counting, market manipulation, and other circumstances that may undermine the effectiveness of the measure. One of the most significant challenges of applying the cap and trade model to the issue of GHG emissions is the lack of proven technologies for reducing emissions. Furthermore, a carbon cap and trade program would apply to a more significant portion of the economy and across a much broader set of emission sources than the ARP and CAIR examples, thus adding to the complexity in determining both economic and environmental impacts.
Despite the momentum of carbon cap and trade as the most likely GHG emissions reduction policy option for the United States, there are still other alternatives under consideration (Table 2), the most common of which is a carbon tax (Table 3).
Table 2. Alternative Methods of Regulating GHG Emissions
| Regulatory Method | Basic Policy Structure |
| Emission Caps | Mandated limits within a time frame that states a maximum level of permitted emissions. This is not exclusive of cap-and-trade policy. |
| Discounting | Reduces future costs and benefits to a present value to incentivize conservative energy spending. |
| Emissions Tax | Taxes applied to all emissions, with no ceiling or cap applicable. |
| Emissions Trading | A market policy allowing emitters to trade emissions with one another. This policy lowers cost of emissions targets. |
| Cost-Effectiveness | The minimization of the price of conservative emission and other goals in order to make it more achievable. |
| Price Ceilings/Price Floors | The specification of minimum and maximum prices at which emissions may be sold in order to encourage emission-reducing technology. |
| Subsidy | Government payment to promote emission reduction, and thereby reduce costs to consumer. |
Past history of the various bills discussed in Congress suggests that the details of any GHG emissions reduction legislation are likely to undergo extensive negotiation and deliberation as policymakers bring a broad spectrum of knowledge, expertise, and opinions to the table. Regardless of the final legislation, Americans can anticipate a non-linear (i.e., proportionally lower near-term versus long-term) target aiming for approximately 80% reductions in GHG emissions by the year 2050 phased over progressively more stringent annual caps.
Table 3. Carbon Tax Benefits and Challenges
| Actions and Economic Indicators | Carbon Tax Benefits | Carbon Tax Challenges |
| Limitations of Emissions | Taxes levied revenues, discouraging extensive use of GHG | No strict limitation policy, such as implemented in cap and trade |
| Targeted Emissions | Taxes may be designed to reach stabilization through fluctuation | A carbon tax does not guarantee achievement of a particular emissions target |
| Price Predictability | Firm price predictability creates incentive to reduce GHG emissions | If price reaches affordability, no limitations exist |
| Equity | Affordability for the use of GHGs increases | Disproportionate effect on low-income households |
Lifestyle & Impacts
So now you might be asking yourself, how will a carbon cap and trade program affect Floridians? By design, it would be expected to benefit Floridians from a reduction in the most severe effects anticipated to result from unmitigated climate change. These benefits might include improved human health, reduced threat of sea level rise, reduced threat of species extinction and habitat alteration, and other climate related risks to both human and non-human life. However, as climate change is a global issue, it will take global action to realize these benefits.
As a market-based program, cap and trade may benefit Floridians through innovations that lead to low- or no-carbon energy sources and other products and services that evolve from the competitive entrepreneurial spirit anticipated in the scheme’s flexible compliance framework. As a result of the way a carbon cap and trade program would reorganize emitting industries around GHG emissions reductions targets, Floridians may need to prepare for lifestyle changes around products and services related to the point source emitters that fall within the domain of the regulations.
Electric utilities will likely respond to a cap and trade program by fuel switching to generation resources with lower GHG emissions (e.g., natural gas, nuclear and renewable), incorporating new technologies, and/or by investing in carbon offsets (e.g., agriculture, forest, and soil management options). In fact, whether due to market conditions or strategic planning for whatever carbon regulations may come, Florida’s electric utilities have already deeply invested in fuel switching as natural gas use “has nearly doubled in the past decade…[to nearly 70 percent of statewide electric generation fuel supplies and has] almost entirely displaced petroleum, which supplied more than [20 percent] of generation in 2001, and has reduced coal’s share from more than [33 percent] in 2001 to about [20 percent] in 2014.” [5]
Costs of Action vs. Inaction
There is ongoing debate and some uncertainty about the costs of action versus inaction with regards to regulatory policies to reduce GHG emissions. One estimate, extrapolated and misrepresented from a larger “Assessment of US Cap and Trade Proposals” study by the MIT Joint Program on the Science and Policy of Global Change, projects energy costs to rise by approximately $3100 per taxpayer per year. Yet the MIT study author suggested a more accurate estimate derived from their analysis would cost only $800 per taxpayer and a separate US EPA analysis suggested households will see an energy cost increase of between $98 and $140 per year. [6]
Estimations calculate that reductions of GHGs listed in the Clean Power Plan will be worth between $55 billion and $93 billion annually by 2030. The elimination of such gases at these levels will also be instrumental in the prevention of thousands of premature deaths, as well as nearly 150 thousand asthma-related breathing complications.
While exact values may be challenging to ascertain, strong evidence suggests that the benefits of significant, immediate, and sustained climate change mitigation action outweigh the costs of delayed or no action. [7] The Climate Change Impacts and Risks Analysis (CIRA) project summary report, released by the US EPA on June 22, 2015, “estimates the physical and monetary benefits to the US of reducing global greenhouse gas emissions…[using methods and results that] have been peer reviewed in the scientific literature” (Figure 2). [8] The analysis took a three step approach as follows: “[1] developing GHG emissions scenarios; [2] simulating future climate under these scenarios; and [3] applying these projections in a series of coordinated impacts analyses encompassing six sectors (health, infrastructure, electricity, water resources, agriculture and forestry, and ecosystems).” Key findings include the following:
- Global GHG mitigation reduces the frequency of extreme weather events and associated impacts
- e.g., 12,000 annual avoided deaths from 49 major US cities by the year 2100
- Global GHG mitigation avoids costly damages in the US
- e.g., $4.2-$7.4 billion saved through avoided road maintenance
- Climate system inertia delays benefits of GHG mitigation until the year 2050, but these benefits increase over time
- e.g., Decisions made today have long-term effects and delayed action progressively increases environmental, social, and economic risks and consequences
- Adaptation can reduce overall damages in certain sectors
- e.g., Timely coastal adaptation reduces estimated damages by over 80 percent below baseline damages from sea level rise and storm surge
- Impacts vary across time and space
- e.g., Some regions and ecosystems exhibit disproportionately high impact risks and threshold (tipping point) responses to climate change which may be masked when considered across inappropriate time frames or geographic extents
Fortunately, “low hanging fruit” mitigation activities like energy efficiency and conservation in homes, commercial buildings, and consumer electronics are often low cost, quick to implement, and offer rapid returns on their investment. [9]
Figure 2. Climate Change in the United States: Benefits of Global Action. Credit: US EPA.
Added Value of the Florida Energy Systems Consortium
Some of the innovations and GHG emissions reduction compliance strategies may originate or be refined from research currently being conducted by faculty within the Florida Energy Systems Consortium (FESC). From technological research, to policy evaluation, to behavioral campaigns and community outreach, FESC is helping Floridians and our governmental agencies to prepare for all potential futures with federal or state GHG emissions regulations.
References and Resources
See the following links for more information about cap and trade and GHG emissions regulations:
- Federal Aviation Administration (FAA) – United States Aviation Greenhouse Gas Emissions Reduction Plan (June 2012). Retrieved June 26, 2015.
- Florida Department of Environmental Protection (FDEP) – Division of Air Resource Management: Rules and Forms. Retrieved June 26, 2015.
- Florida Public Service Commission (FPSC). (November 2014). Review of the 2014 Ten-Year Site Plans of Florida’s Electric Utilities.
- International Energy Agency (IEA) – Climate Change Publications. Retrieved June 26, 2015.
- League of Women Voters – Cap-and-Trade Versus Carbon Tax: Two Approaches to Curbing Greenhouse Gas Emissions. Retrieved June 26, 2015.
- National Oceanic and Atmospheric Administration (NOAA) – National Centers for Environmental Information: Global Land and Ocean Temperature Anomalies Relative to 20th Century Average. Retrieved June 26, 2015.
- Regional Greenhouse Gas Initiative. Retrieved June 26, 2015.
- US Department of Transportation (DOT) – Transportation and Climate Change Clearinghouse. Retrieved June 26, 2015.
- US Environmental Protection Agency (EPA) – Clean Air Markets: Cap and Trade: Basic Information. Retrieved June 26, 2015.
- US Environmental Protection Agency (EPA) – Clean Air Markets: Market-Based Mechanisms: Cap and Trade Resources. Retrieved June 26, 2015.
- US Environmental Protection Agency (EPA) – Climate Change Impacts and Risks Analysis (CIRA) Report (June 2015). Retrieved June 26, 2015.
- US Environmental Protection Agency (EPA) – Greenhouse Gas Reporting Program (GHGRP). Retrieved June 26, 2015.
- US Environmental Protection Agency (EPA) – Greenhouse Gas Reporting Program (GHGRP): Implementation Fact Sheet. Retrieved June 26, 2015.
- US White House – Climate Change and President Obama’s Action Plan. Retrieved June 26, 2015.
Acknowledgements
Authors: Hal S. Knowles IIIa, Patricio A. Rochab, Tapas K. Dasb, and Julie Harringtonc
Reviewers: Julie Ferrisd (2010 and 2015 PENDING)
a Program for Resource Efficient Communities, Florida Cooperative Extension Service, Institute of Food and Agricultural Sciences, University of Florida, Gainesville, FL
b PJM Interconnection; Formerly with the Department of Industrial and Management Systems Engineering, University of South Florida, Tampa, FL
c Center for Economic Forecasting and Analysis, Florida State University, Tallahassee, FL
d Florida Department of Environmental Protection, Division of Air Resource Management, Tallahassee, FL
First published January 2010. Revised June 2015.
This is a fact sheet for the Florida Energy Systems Consortium (FESC). The goal of the consortium is to become a world leader in energy research, education, technology, and energy systems analysis.
Footnotes
[1] Final Mandatory Reporting of Greenhouse Gases Rule (http://www.epa.gov/climatechange/emissions/ghgrulemaking.html)
[2] Components based on the U.S. EPA SO2 Trading Program (http://www.epa.gov/airmarkets/progress/ARP_4.html)
[3] 2012 U.S. Environmental Protection Agency, Office of Atmospheric Programs. Tools of the Trade: A Guide to Designing and Operating a Cap and Trade Program for Pollution Control. Cap and Trade: Essentials. http://www.epa.gov/captrade/
[4] US Environmental Protection Agency. (December 2009). Acid Rain and Related Programs: 2008 Highlights. Report No. EPA-430-R-09-031. pp. 8. Retrieved June 26, 2015.
[5] US Energy Information Agency (EIA). Florida State Energy Profile. Analysis section “last updated: May 21, 2015.” Retrieved June 26, 2015
[6] 2015 Fact Check on Suspected Energy Cost Inflation (http://www.factcheck.org/2009/05/cap-and-trade-cost-inflation/). Retrieved on June 25, 2015.
[7] See statement, released on March 29, 1997, endorsed by over 2500 economists including nine Nobel Laureates (http://www.rprogress.org/publications/1997/econstatement.htm). Retrieved on June 26, 2015.
[8] US Environmental Protection Agency (EPA). (June 22, 2015). Climate Change in the United States: Benefits of Global Action. Retrieved June 26, 2015.
[9] Pacala, S. and R. Socolow. Stabilization wedges: Solving the climate problem for the next 50 years with current technologies. Science, 2004. 305: p. 968-972. (http://dx.doi.org/10.1126/science.1100103)