Introduction
When it comes to evaluating home energy performance, most Florida Homeowners receive their feedback in a very recognizable, and not always welcome, form: a dollar amount due to the utility on their monthly energy bill. Usually, the only way to gauge how your home performs is to take the difference between the consumption of your current month, and compare it to previous bills. Some utilities offer tables and charts of historical consumption so that homeowners can track their usage, but when it comes to energy performance, how do homeowners know how their home is doing overall? Are homeowners using energy wisely or is there room for some major improvements? To answer these questions, homeowners need a baseline[1], as a starting point, to compare against their own energy usage.
To understand energy baselines and comparisons, let’s first begin with the reading on your electricity bill.
Reading your Electricity Bill
In order to determine how much to bill their customers, utilities need to record how much each individual home uses. The utility provides an electric meter that keeps a running tally of the total amount of electricity, in kilowatt-hours (kWh), used in the home. Electric meters can either be analog, with a series of dials like in Figure 1, or they can be electronic with a digital display.
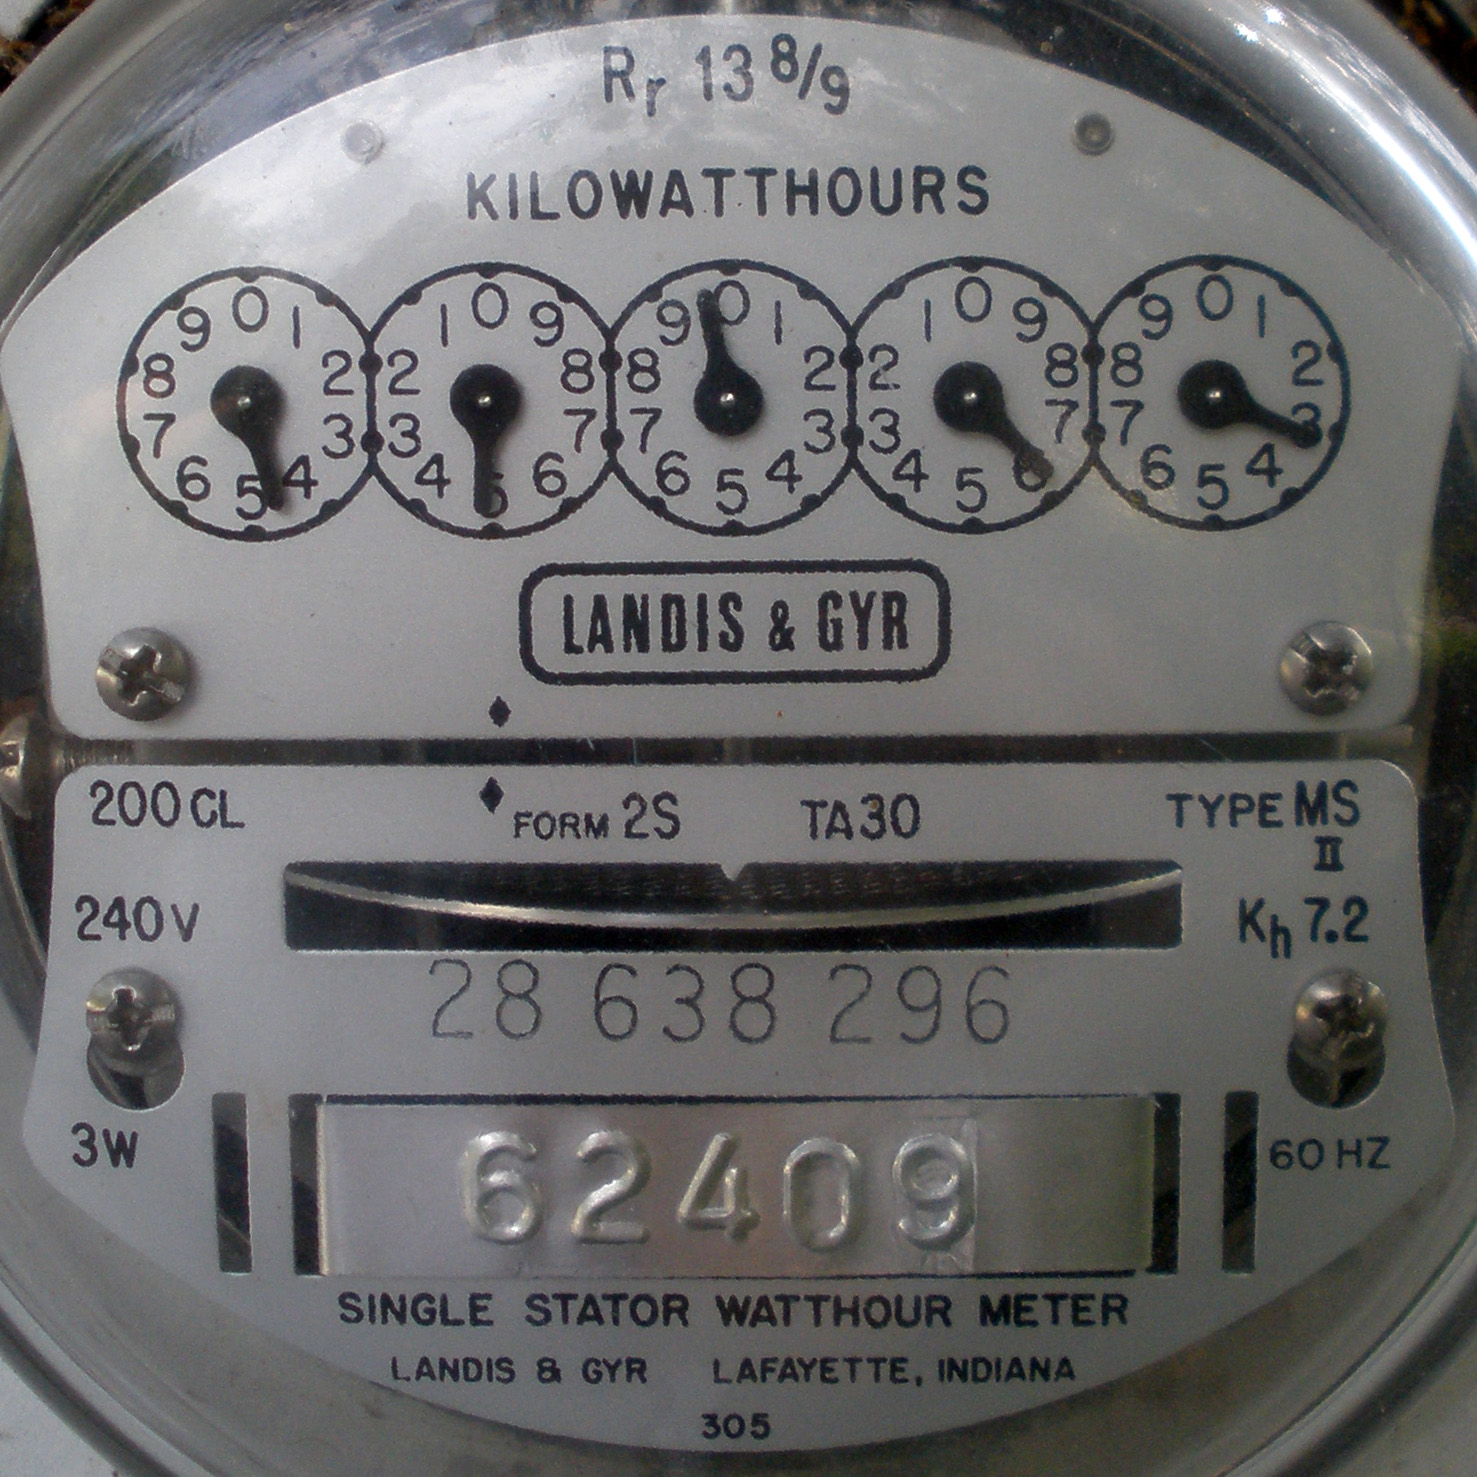
Figure 1: Residential analog electric meter. Credit GRU.
To read an analog electric meter, look at the circular dials that resemble the face of a clock. Read the meter by looking at the dials from left to right. For each dial the arrow will be between two numbers and the reading is taken as the lower of the two numbers, just like a clock! The meter shown in Figure 1 reads 45963 kilowatt-hours. If the previous meter reading was 45000, then the electric use between the readings would have been 963 kilowatt-hours (45963 – 45000 = 963). Your utility provider would then apply their billing rate structure and associated fees, and taxes to calculate the total electric bill. Most electric utilities have a tiered rate structure where the more energy you use the more it costs per kilowatt-hour. The sample electric bill shown in Figure 2 has information about meter readings, rate structure, fees, and taxes. Natural gas and liquid propane (LP gas) are metered and billed much like electricity but may have different billing rate structures, fees, and taxes. Note that some utility providers offer “time-of-use pricing” offering lower prices for energy used during times when there is less energy demand[2]. Billing details for your energy use can be found either on your monthly utility bill or on the utility company’s website. Time-of-use pricing is prevalent in States like California and New York. The next step is to find out what typical energy use and energy bills are like in homes similar to yours. Energy use in these “similar homes” will become your baseline. Aren’t you interested how much energy your neighbors are using?
![Figure 2: Sample residential electric bill. [Click image for full size version.] Credit: Florida Power & Light Company.](http://www.myfloridahomeenergy.com/wp-content/uploads/2015/06/Residential-Bill.png)
Figure 2: Sample residential electric bill. [Click image for full size version.] Credit: Florida Power & Light Company.
Seasonal Energy Use
Energy use varies over the course of the year and across years in relation to weather. When the weather is mild, in the spring and fall seasons, less energy is needed for heating and cooling. Months in the spring and fall are considered “shoulder months” where water heating, appliances, electronics, and lighting create “base energy consumption”[3] within a home. When temperatures are more extreme, in summer and winter seasons, energy used for heating and cooling add to the total energy used in a home resulting in “peak energy consumption” periods. Seasonal energy use can impact accuracy of energy baselines and comparisons of energy performance.
Baselines
When assessing home energy performance or energy savings you need a baseline or benchmark, as a starting point, to measure from. Baselines for home energy performance are different for different types of houses and they vary over time in relation to weather and other factors. This section will provide a general overview of energy baselines and how they are used to measure energy performance in homes.
Types of Baselines
In the real world, people use many different types of baselines to compare their energy use. Some might talk with friends or neighbors about their utility bills as a basis for comparing energy consumption while others might rely on online survey tools or a professionally conducted energy analysis. There are two general approaches[4] to creating energy baselines for buildings; energy simulation models and data-driven models.
Energy Simulation Models
Energy simulation models use detailed information about the building’s characteristics (design and construction, materials) and about its mechanical systems (heating, air-conditioning, appliances, and lighting). Insulation values (R-value[5]) of the floors, ceilings, walls, windows, and air-tightness (leakiness) of the building help determine the heat load (how fast the building will heat-up or cool-down to meet outdoor temperatures). Information about efficiencies of the mechanical systems, and assumptions about how they will be used, provides an expected energy use for the building. Energy simulation models are generally used by engineers, field technicians, or building managers by entering building characteristics into desktop software platforms or online survey tools. The simulation models use pre-defined mathematical algorithms that estimate heating and cooling loads in the building based on both internal (heat emitted by occupants, lighting, equipment, etc.) and external (solar radiation on the buildings, wind loads, etc.) interference to the zone, and the output is returned to the user as a predicted energy consumption (kWh/yr or $/yr) for the building.
Example:
There are 10 standard, 40-watt incandescent lights and we assume that they will each be on for an average of 3 hours per day. When all 10 lights are on at the same time they will use 400 watts of electricity (10 lights × 40 watts = 400 watts). Used for 3 hours per day, they will consume 1,200 watt-hours per day (400 watts × 3 hours = 1,200 watt-hours). One thousand watt-hours is equal to one kilowatt-hour (1,200 watt-hours ÷ 1000 kilowatt hours per watt = 1.2 kilowatt-hours). During one year the lights will use 438 kilowatt-hours (1.2 kilowatt-hours × 365 days per year = 438 kilowatt-hours per year). If the electricity costs 13 cents per kilowatt-hour, the cost to use these lights for one year will be $56.94.
In energy simulation models, the logic used in the example above is simple, but in a building energy simulation software, this is repeated and compounded for each electric component in the home (like heating, air conditioning, appliances, electronics, etc.). Interactions between components can become very complex.
The U.S. Department of Energy (DOE) provides a Building Energy Software Tools Directory that lists hundreds of software platforms and applications, many of which rely on the four foundational simulation programs that provide whole building energy analysis, assess compliance with energy codes and standards, assess building materials, components, equipment and systems, and evaluate environmental impacts. The most common energy simulation models used in Florida (“Florida House Bill: HB7147” 2014) are the DOE’s Home Energy Score, the Commercial Energy Services Network’s (COMNET) Commercial Buildings Energy Model, and the Residential Energy Services Network’s (RESNET) EnergyGauge USA. Of these, RESNET’s EnergyGauge USA platform may be the most familiar to Florida homeowners as it underlies the Home Energy Rating System (HERS) index used to qualify buildings that meet the Florida Building Code 5th Edition (2014), Residential, the U.S. Environmental Protection Agency (EPA) ENERGY STAR® Homes certification, and the DOE Building America Program requirements.
Data-Driven Models
Data-driven models use historic energy consumption in a building, information about similar buildings and/or weather data to create baselines of energy performance. Statisticians, economists, building managers or utility staff, generally use data-driven models to assess performance or energy savings related to green building initiatives or energy conservation measures. Utility billing data, basic building characteristics, and weather data are used in ways ranging in complexity from simple pre- versus post- energy consumption to advanced econometric statistical models. Common types of data-driven models are time-series models (pre- versus post-), weather normalization models like the Princeton Scorekeeping Method (PRISM), and comparison group models.
The simplest version of a data-driven baseline would be a basic time series comparison that looks at energy consumption in the same building in a prior year. The historic energy use for the building creates the baseline for comparison. The larger question the baseline answers; is the building using more or less energy than it did in the past? The sample utility bill in Figure 2 gives a comparison of daily electricity use between the current usage and the usage for the same month in the previous year. The majority of energy use in most homes in Florida is due to cooling. It should be noted that the pre- versus post- comparison approach ignores changes in weather that might affect how much heating or cooling was used in the building and is not generally a reliable comparison.
One approach is to “normalize” the weather to account for differences in heating and cooling use from one year to the next. Weather normalization usually involves calculating heating and cooling degree-days (HDD & CDD respectively) to approximate how much heating or cooling would be needed against a base temperature. A degree-day is the difference between the average temperature during a day and an assumed comfortable temperature for the home. Degree-days are most often calculated from 65°F.
Example:
If the average temperature for the day was 85°F there would be 20 cooling degree days assigned to that day (85°F – 65°F = 20 CDD). If the average temperature for the next day was 81°F (81°F – 65°F = 16 CDD) we would expect to use 20% less energy for heating and cooling ([(20-16)/20] x 100 = 20%).
Weather normalization models must incorporate assumptions about the portion of energy consumption used for heating and cooling because base energy consumption is generally unaffected by weather.
Using a comparison group model is among the most reliable data-driven modeling techniques. In general, comparison group baselines are made up of homes in the same geographic area, with similar occupancy, in the same time period. Many times, comparison groups can be selected from the same residential subdivision or surrounding neighborhoods. Similar homes are selected either by a data analyst or by using a statistical model like regression or cluster analysis. Using comparison group baselines reduces the need for weather normalization because all homes experience the same weather patterns, and energy consumption is compared for the same time period. Differences in energy efficiency features and occupant behavior drive relative energy performance.
Tools for Florida homeowners
Florida homeowners have access to several online energy simulation modeling tools to assess their energy performance. Online energy audits available through the USDOE Home Energy Saver and the Florida Department of Agriculture and Consumer Services (FDACS) My Florida Home Energy are good starting points for creating baselines of home energy use.
The survey tools mentioned allow homeowners to enter information about their homes, their families and their behaviors and provide expected energy consumption for the home along with tips and strategies to lower energy use. The webpage shown in Figure 3 is the home page for the My Florida Home Energy website. My Florida Home Energy provides a library of information about energy efficiency tips and technologies, available incentives, finding contractors and financing options.
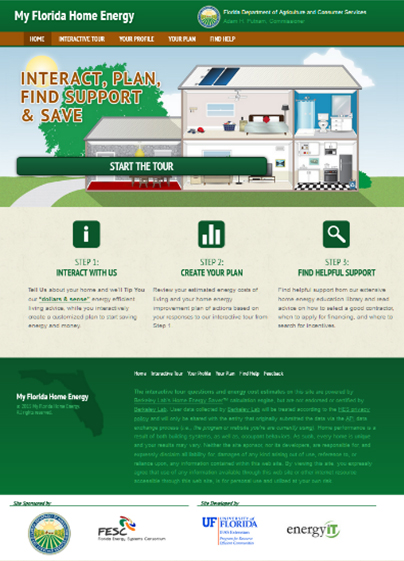
Figure 3: My Florida Home Energy online energy audit tool. Credit: PREC.
Note that most energy simulation modeling tools provide estimated energy use baselines in kilowatt-hours per year or dollars per year so you will need 12 months of energy records to measure performance against the baseline provided by the model. Your utility may provide access to your past energy records when you call or log in to their website[6].
Gathering your past energy records, viewing comparisons on your utility bill, and using the online energy simulation modeling tools listed above will provide homeowners a good starting point for assessing their energy performance.
References and Resources
Coakley, Daniel, Paul Raftery, and Marcus Keane. (2014). A Review of Methods to Match Building Energy Simulation Models to Measured Data.
Commercial Energy Services Network. (2015). Commercial Buildings Energy Modeling Guidelines & Procedures (MGP). Retrieved May 4, 2015.
Efficiency Valuation Organization. (2012). IPMVP: Concepts and Options for Determining Energy and Water Savings. Retrieved May 4, 2015.
Energy Lens: Energy Management Made Easy. (2015). Degree Days – Handle with Care!. Retrieved April 27, 2015.
EnerLogic, & James J. Hirsch & Associates. (2015). “DOE-2 Building Energy Use and Cost Analysis Software.” Retrieved May 4, 2015.
Environmental Energy Technologies Division Lawrence Berkeley National Laboratory. (2015). Home Energy Saver. Retrieved May 4, 2015.
Florida Building Commission. (2014). Florida Building Code 5th Edition (2014), Residential. International Code Council. Retrieved May 4, 2015.
Florida House of Representatives. (2014). Florida House Bill: HB7147. Retrieved May 4, 2015.
Florida Power & Light Company. (2015). How to Read Your Bill. Retrieved May 4, 2015.
Florida Solar Energy Center. (2015). EnergyGauge: Residential Code Compliance and Home Energy Rating Software. Retrieved May 4, 2015.
Fumo, Nelson. (2014). A review on the basics of building energy estimation. Renewable and Sustainable Energy Reviews, 31, (C), 53-60. Retrieved May 4, 2015.
Jayaweera, Tina, & Hossein Haeri, eds. (2013). The Uniform Methods Project: Methods for Determining Energy Efficiency Savings for Specific Measures. Retrieved May 4, 2015.
Niko Dietsch. (2007). Model Energy Efficiency Program Impact Evaluation Guide. Retrieved May 4, 2015.
Program for Resource Efficient Communities. (2015). My Florida Home Energy. Retrieved May 4, 2015.
Princeton University. (2015). PRISM: Measuring Savings the Easy Way. Retrieved May 4, 2015.
Residential Energy Services Network (RESNET). (2015). Home Energy Rating. Retrieved May 4, 2015.
University of Strathclyde. (2015). “ESP-R.” Retrieved May 4, 2015.
University of Wisconsin Madison. (2015). TRNSYS: Transient Systems Simulation Program. Retrieved May 4, 2015.
US Department of Energy (US DOE). (2015). Home Energy Score. Retrieved May 4, 2015.
US Department of Energy (US DOE) Building Technology Office. (2015). EnergyPlus Energy Simulation Software. Retrieved May 4, 2015.
US Energy Information Administration (EIA). (2015). EIA – Trends in Heating and Cooling Degree Days: Implications for Energy Demand. Retrieved April 27, 2015.
US Environmental Protection Agency (US EPA). (2014). Heating and Cooling Degree Days. Retrieved May 4, 2015.
Wikimedia Commons. (2015). Electrical Meter. Retrieved June 14, 2015.
Acknowledgements
Authors: Nicholas Taylora, Lesly Jeromea
Reviewer: Ravi Srinivasanb (2015)
a Program for Resource Efficient Communities, Florida Cooperative Extension Service, Institute of Food and Agricultural Sciences, University of Florida, Gainesville, FL.
b M.E. Rinker, Sr., School of Building Construction, University of Florida, Gainesville, FL
First published June 2015.
This is a fact sheet produced for the Florida Energy Systems Consortium (FESC). The goal of the consortium is to become a world leader in energy research, education, technology, and energy systems analysis.
Footnotes
[1] Merriam-Webster’s Collegiate Dictionary. (2005). Baseline. Retrieved May 4, 2015.
[2] Energy demand is the amount of energy needed to run a home at a given point in time and is measured in watts or kilowatts. Energy consumption is the amount of energy used over a period of time and is generally measured in kilowatt-hours.
[3] Peak energy load and base energy load are used to describe energy demand (kW) during a point in time. Peak energy consumption and base energy consumption are used to describe energy consumption (kWh) during longer periods of time like months or seasons. Fluctuations in energy load are very important to utility providers in optimizing energy production. Fluctuations in energy consumption can provide important feedback to help homeowners prioritize efficiency improvements.
[4] There are also various forms of mixed-model approaches that use both simulation and data-driven modeling techniques, however, the complexity of these models is beyond the scope of this document.
[5] Insulation is rated in terms of thermal resistance, called R-value, which indicates the resistance of the insulation material to heat flow across its structure. The higher the R-value, the greater the reduction in heat flow and thus the greater the insulation effectiveness. The R-value is additive across layers and depends on the type of materials, their thickness, and their density. (See more on the Insulation fact sheet)
[6] Although some utility providers allow customers to access billing records online, there are few resources for Florida homeowners that provide robust data-driven benchmarking tools.