Quick facts
- Wind is a result of uneven heating of the atmosphere by the sun, irregularities of the earth’s surface, and rotation of the earth.[1]
- In 2013, wind-generated power supplied almost 4% of the world’s electrical demands.[2]
- Between 2000 and 2013, wind electricity generation grew by a factor of 18.[3]
- In 2013, wind facilities installed in the U.S. had a combined electrical generation capacity that accounted for 36% of the nation’s renewable capacity and 5% of all In the same year, over 4% of the electricity generated nationwide came from wind power.[4]
- By the end of 2013, there was more wind power capacity under construction in the U.S. than at any time previously.[5]
- While commercial offshore wind turbine projects have been proposed in the U.S., none have yet been commissioned for construction.[6]
For readers interested in learning more about the vocabulary associated with wind energy, check out definitions of many wind energy terms here.
History
People have used wind energy for centuries to sail vessels, operate granaries, pump water, and more. Wind propelled boats along the Nile River as early as 5,000 B.C. and helped Persians pump water and grind grains between 500 and 900 B.C.[7] The following timeline, from the U.S. Department of Energy, provides a short history of wind energy primarily emphasizing activities in the U.S.:
1850s Daniel Halladay and John Burnham start the U.S. Wind Engine Company and build the Halladay Windmill, which is designed for the landscape of the American West.
Late 1800s Wind power in North America helps farmers and ranchers pump water for irrigation and windmills generate electricity for homes and businesses.
Late 1890s The invention of steel blades for windmills makes them more efficient and as homesteaders move west, more than six million windmills are erected throughout the countryside.
1890 Larger windmills, called wind turbines, begin appearing on hills in Denmark.
1893 The Chicago World’s Fair showcases 15 windmill companies and their wind turbine designs.
1940s The largest wind turbine begins operating on a Vermont hilltop known as “Grandpa’s Knob.” It is rated at 1.25 megawatts (MWs) in winds of about 30 mph and feeds electric power to the local utility network for several months during World War II. [Note that one megawatt is equal to one thousand kilowatts or 1 million watts.]
1950s Most wind turbines in the United States are shut down because of disuse.
1970s The price of oil skyrockets and so does interest and research in wind turbines and the power they generate.
1978 Congress passes the Public Utility Regulatory Policies Act of 1978, which requires companies to buy a certain amount of electricity from renewable energy sources, including wind.
1981 National Aeronautics and Space Administration scientists Larry Viterna and Bob Corrigan develop “The Viterna Method,” which goes on to become the most common method used for predicting wind turbine performance, thus increasing the efficiency of turbine output to this day.
1990 More than 2,200 MWs of wind energy capacity is installed around California, creating more than half of the world’s capacity for wind power.
1992 The Energy Policy Act authorizes a production tax credit of 1.5 cents per kilowatt hour (kWh) of wind-power-generated electricity and re-establishes a focus on renewable energy use.
2000 The cost of wind-power-generated electricity is between 4 to 6 cents per kWh.
2004 The cost of electricity from wind-generated sources drops to 3 to 4 cents per kWh.
2007 Wind produces enough energy to power roughly 2.5 million homes and makes up 5% of the renewable used in the U.S.
2008 The U.S. Department of Energy publishes their 20% Wind Energy by 2030 initiative.
2012 The amount of wind energy produced in the U.S. reaches the point of being able to power 15 million homes and becomes the number-one source of renewable electricity.
2013 Jose Zayas, Wind Program Director, announces Wind Vision, a new initiative to revisit the findings of the 2008 report.
Note that Wind Vision is a public-private sector collaboration led by the U.S. Department of Energy (DOE) to expand the use of wind power and to update and expand the 2008 DOE 20% Wind Energy by 2030 report mentioned above. With the huge changes within the industry and the U.S. energy market since 2008, DOE launched this initiative to examine U.S. wind power research, development, and deployment with the intention of creating a new vision based on current market conditions.[8]
2015 The DOE releases a new report looking at the future of wind power through 2050 and the economic benefits that come with a robust wind industry: Wind Vision: A New Era for Wind Power in the United States.
Overview
Table 1 shows worldwide installed wind capacity as of 2013. Installed wind capacity refers to the total amount of wind turbine rated capacity all of the wind turbines can produce at their rated wind speed. Three countries—China, the U.S. and Germany—provide over half of the total worldwide wind capacity of 318 gigawatts (GW).[9]
Table 1. Worldwide Installed Wind Capacity for 2013
| IEA Wind Members i | Rest of World ii | ||
| Country | Megawatts | Country | Megawatts |
| China | 91,413 | India | 20,150 |
| United States | 61,110 | France | 8,254 |
| Germany | 34,660 | Other countries iii | 4,820 |
| Spain | 22,959 | Brazil | 3,390 |
| United Kingdom | 10,861 | Poland | 3,390 |
| Italy | 8,554 | Turkey | 2,959 |
| Canada | 7,803 (est) | Romania | 2,600 |
| Denmark | 4,808 | New Zealand | 623 |
| Portugal | 4,709 | Taiwan | 614 |
| Sweden | 4,469 | Egypt | 550 |
| Australia ii | 3,239 | Chile | 335 |
| Netherlands | 2,709 | Morocco | 291 |
| Japan | 2,670 | Thailand | 223 |
| Ireland | 1,896 | Argentina | 218 |
| Greece ii | 1,865 | Ethiopia | 171 |
| Austria | 1,684 | Costa Rica | 148 |
| Mexico | 1,551 | Nicaragua | 146 |
| Norway | 811 | Pakistan | 106 |
| Korea | 561 | Tunisia | 104 |
| Finland | 448 | Honduras | 102 |
| Switzerland | 60 | ||
| Total IEA Wind | 268,840 | Total Rest of World | 49,265 |
| Grand Total 318,105 | |||
| i Numbers reported by IEA Wind member countries—see note (a) below ii Numbers reported by GWEC (2014)—see note (b) below iii Countries not in this list or in IEA Wind (a) Twenty one countries, representing nearly 85% of the world’s wind generating capacity, participate in the International Energy Agency (IEA) Wind implementation agreement. This international group shares information and research to advance the use of wind energy. (b) GWEC stands for Global Wind Energy Council, which is a member-based organization representing the entire wind energy in more than 70 countries. |
|||
In the U.S., cumulative installed wind capacity increased only 1.8% in 2013, much lower than capacity increases in previous years. However, wind generation increased by nearly 20%, reflecting new generation from capacity installed in 2012.[10] Wind generation refers to the electricity that was actually produced.
Using wind as a clean energy source has already helped the power sector reduce its water, greenhouse gas emission, and air pollution footprint.[11] This trend is expected to continue. The Wind Vision—a U.S. initiative to meet 10% of the nation’s electricity demands from wind by 2020 and 20% by 2030—estimates a reduction in electric-sector water consumption of approximately 6% by 2020 and 16% by 2030.
Figure 1 depicts the growth in electricity generation from the top five sources of renewable energy in the U.S. between 2000 and 2013.[12] Wind generation has been climbing rapidly since about 2007. Renewable energy sources like wind typically involve substantial upfront costs, but the long-term savings in reduced fossil fuel consumption and reduced environmental impact may justify the near-term investment. Between 2014 and 2050, meeting goals of the Wind Vision is projected to result in about 3% or $150 billion in savings, primarily due to reduced fossil fuel consumption.[13]
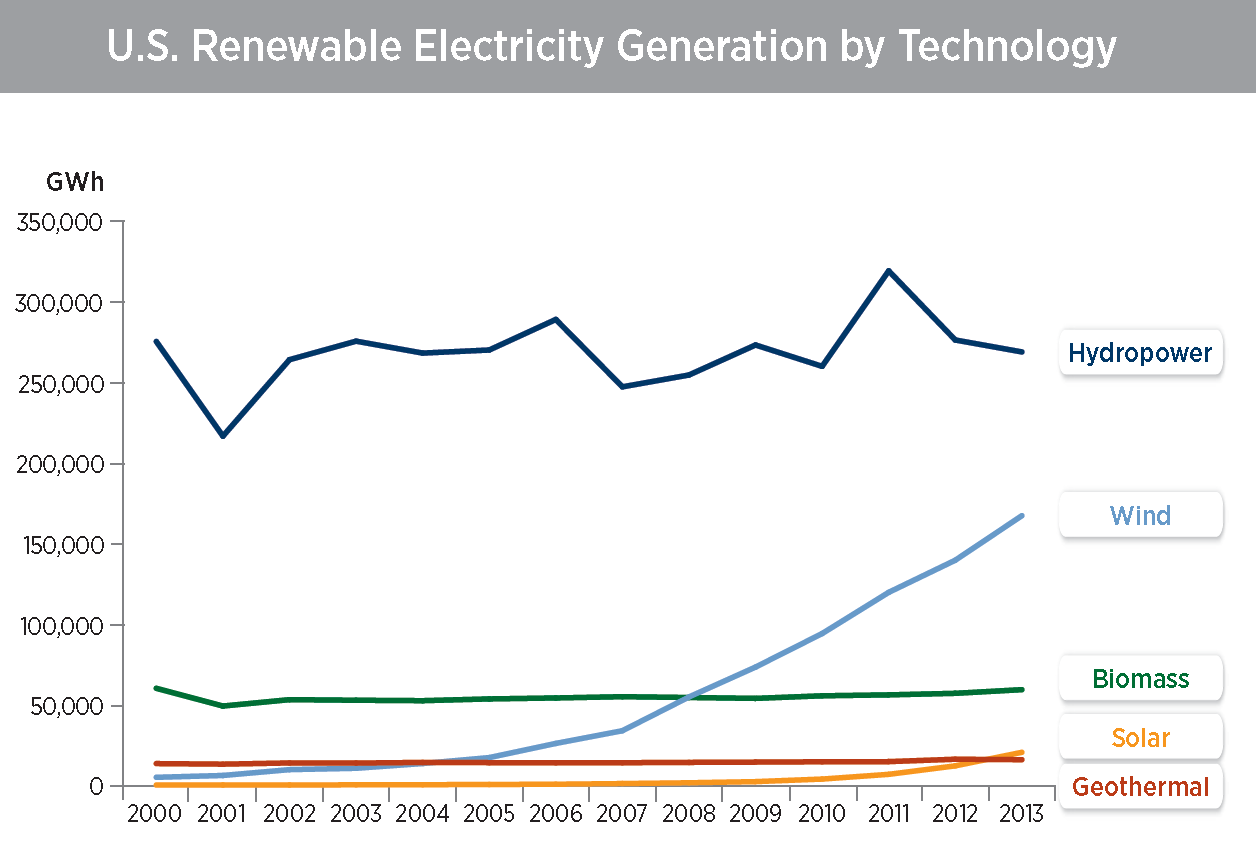
Figure 1. U.S. Renewable Electricity Generated by Technology. [Click image for full size version.]
Conventional power plant air pollutants such as SO2, NO2, mercury, and others have created various unintended and adverse consequences to our environment. These range from increased incidences of children with asthma to fish with unhealthy levels of mercury. Renewable energy technologies like wind power offer an alternative source of clean power. The Wind Vision analysis team studied the public health and environmental benefits of the Wind Vision scenario.[14] They found that in 2013, with just 4% of all electricity in the U.S. generated from wind, there was “96 million metric tons of avoided CO2—equivalent to taking nearly 17 million cars off the road. And, also in 2013, wind displaced SO2 and NO2 emissions achieving approximately a 2% and 4% reduction respectively.”
How Do We Get Energy from the Wind?
Florida residents have become accustomed to paying attention to the wind. In fact, we are usually concerned with too much wind from hurricanes and other severe weather events. We can use wind to our advantage, by harnessing and converting it into electricity through the use of a turbine.
Wind turbine is the term now used for what has historically been called a windmill. Fifty to 100 turbines are typically combined to make a wind farm. With over 8,000 components in one wind turbine, you would think that making electricity from the wind would be a very complicated process.[15] However, the concept is really quite simple. When the wind is blowing, it turns two or three blades, which usually look like propellers, around a rotor. This rotor is connected to a main shaft that spins a generator to produce electricity.
![Figure 2 The Inside of a Wind Turbine[16]](http://www.myfloridahomeenergy.com/wp-content/uploads/2015/06/windTurbineLabels.png)
Figure 2. The Inside of a Wind Turbine[16] [Click image for full size version.]
Figure 2 diagrams the main inner workings of a wind turbine and this website, How Does a Wind Turbine Work?, has an animation showing how a wind turbine works. For more detailed information about wind turbines, view What’s Inside a Wind Turbine?
What do we need to get electrical energy from the wind?
Use of renewable energy to generate electricity is increasing around the globe, as shown in Table 2.[17] Wind energy in the U.S. is also increasing, yet there are many factors that determine the feasibility and cost effectiveness of wind energy from one geographic location to the next. Wind energy in Florida and the Southeastern U.S. is not as practical or cost effective as in other parts of the country, yet Florida does play an important role in national and global markets for wind energy. Furthermore, two main factors are very important when determining where to site a wind turbine for maximum efficiency: wind speed and duration. This section discusses both of these factors and how they relate to wind energy potentials and installed capacity in general and in Florida, specifically.
Table 2. Global Renewable Electricity Generation as a Percentage of Total Generation
| Year | Hydropower | Solar (PV* and CSP) | Biomass | Wind | Geothermal | All Renewables | Renewable Generation (GWh) |
| 2000 | 16.8% | 0.0% | 1.2% | 0.3% | 0.3% | 18.7% | 2,727,082 |
| 2001 | 17.3% | 0.0% | 1.3% | 0.4% | 0.3% | 19.3% | 2,872,463 |
| 2002 | 17.1% | 0.0% | 1.2% | 0.5% | 0.3% | 19.2% | 2,953,879 |
| 2003 | 18.0% | 0.0% | 1.2% | 0.7% | 0.3% | 20.2% | 3,211,282 |
| 2004 | 17.3% | 0.0% | 1.1% | 0.8% | 0.3% | 19.5% | 3,247,899 |
| 2005 | 16.9% | 0.0% | 1.2% | 0.9% | 0.3% | 19.4% | 3,358,626 |
| 2006 | 16.7% | 0.1% | 1.2% | 1.1% | 0.3% | 19.4% | 3,488,055 |
| 2007 | 16.4% | 0.1% | 1.3% | 1.3% | 0.3% | 19.3% | 3,644,173 |
| 2008 | 16.6% | 0.1% | 1.3% | 1.7% | 0.3% | 20.0% | 3,822,689 |
| 2009 | 17.2% | 0.1% | 1.5% | 2.2% | 0.4% | 21.3% | 4,064,206 |
| 2010 | 16.6% | 0.2% | 1.6% | 2.6% | 0.3% | 21.3% | 4,319,733 |
| 2011 | 16.4% | 0.4% | 1.7% | 3.0% | 0.3% | 21.7% | 4,582,578 |
| 2012 | 16.3% | 0.6% | 1.8% | 3.4% | 0.3% | 22.4% | 4,891,891 |
| 2013 | 15.9% | 0.8% | 1.8% | 3.7% | 0.3% | 22.6% | 5,095,079 |
| * Grid-connected only | |||||||
Wind speeds typically increase with altitude. Due to reduced ground friction, wind speeds are higher over open and flat areas as compared to those over rougher terrains. Also, wind ‘speeds up’ over topographies with hills. Moreover, wind accelerates while flowing through channels (such as mountain gaps) due to Venturi effect. So ideal wind turbine sites include the tops of smooth, rounded hills, open plains or shorelines, and mountain gaps that funnel and intensify wind. This wind speed and direction map of the U.S. is an artist’s representation of historical wind data that allows viewers to quickly discern the geographic regions with the greatest wind potential.[18] Here’s a wind speed and direction map that can be searched by city.[19] Additional wind speed and direction maps, including those specific to Florida, are available here. This document lists average monthly and annual wind speeds from 1930-1996 for fifteen Florida cities (along with other major cities around the country). It is important to recognize, however, that even within a region of high wind energy potential, specific sites should be evaluated on a case-by-case basis as proximity to buildings, water and many other factors can affect wind speed and duration.
The U.S. Department of Energy indicates that sites with annual average wind speeds around 6.5 meters per second (~14.5 miles per hour) and at least 80 meters (~262 feet) in altitude are generally considered to have a wind resource suitable for wind development.[20] At the utility-scale, land-based (onshore) wind turbines are usually installed at altitudes of between 80 and 100 meters (~262 to 328 feet). Yet hub heights for new installations are increasing—with some up to 140 meters (~459 feet)—to gain access to better wind resources at higher altitudes. See Figure 3 for a visual of changes in wind turbine hub height, rotor diameter and ratings in terms of kilowatts since 1980 and projections for the future.[21]
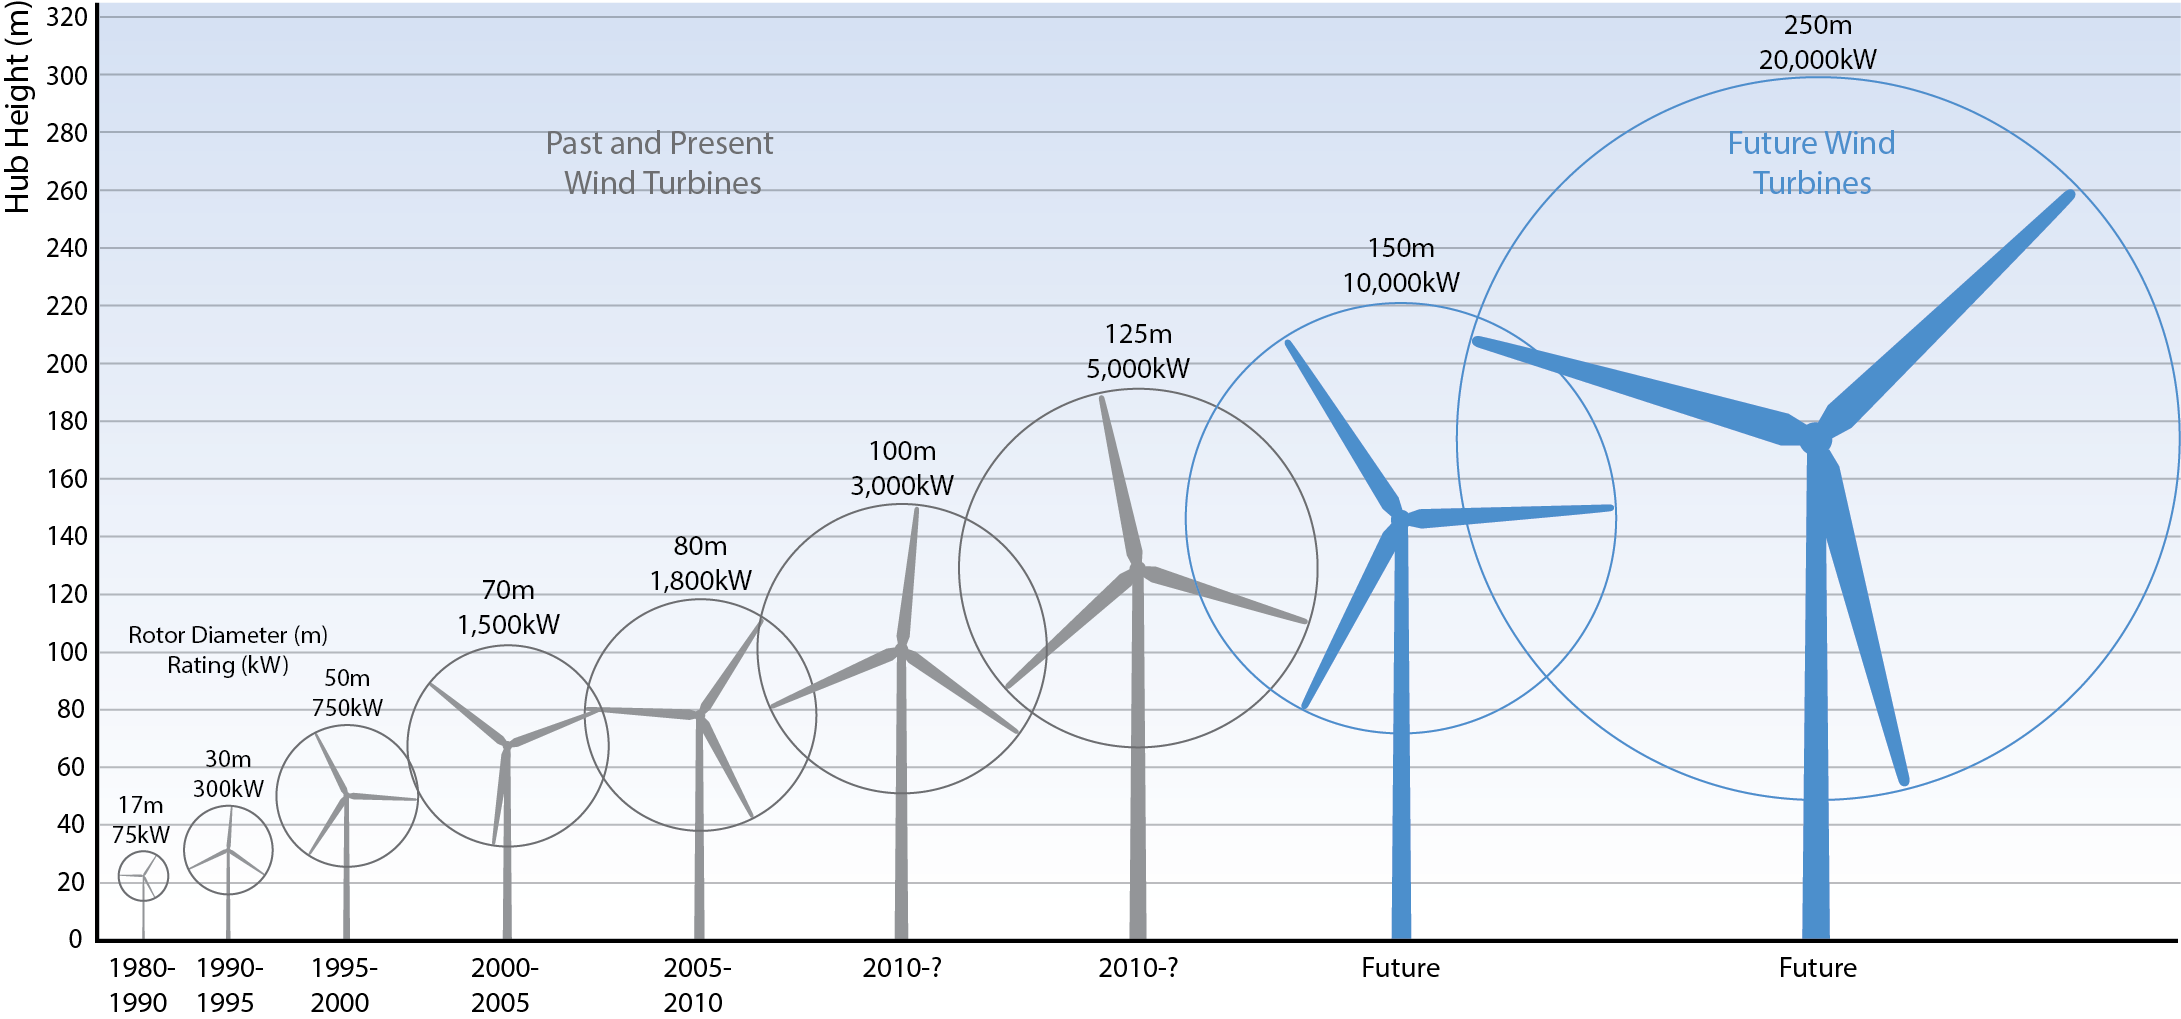
Figure 3. Growth in Size of Typical Commercial Wind Turbines. [Click image for full size version.]
“Small wind” is distributed and run primarily at residential sites for use on site. Generally, annual average wind speeds greater than four meters per second (~9 miles per hour) are required for small wind electric turbines (less wind is required for water-pumping operations). Small wind sites generally have a maximum height of 30 meters (~98 feet) due to local ordinances. A recently released report on small wind projects, nation-wide, is available here.
The map shown in Figure 4 shows the current installed wind power capacity in the United States of all utility-scale projects/turbines with hub heights ranging from 40 to 100 meters (~131 to 328 feet). [22] As you can see, states in the Southeast have very little installed wind capacity. Figure 5 shows land-based and offshore annual average wind speeds in the U.S. at the 100 meter hub height.[23]
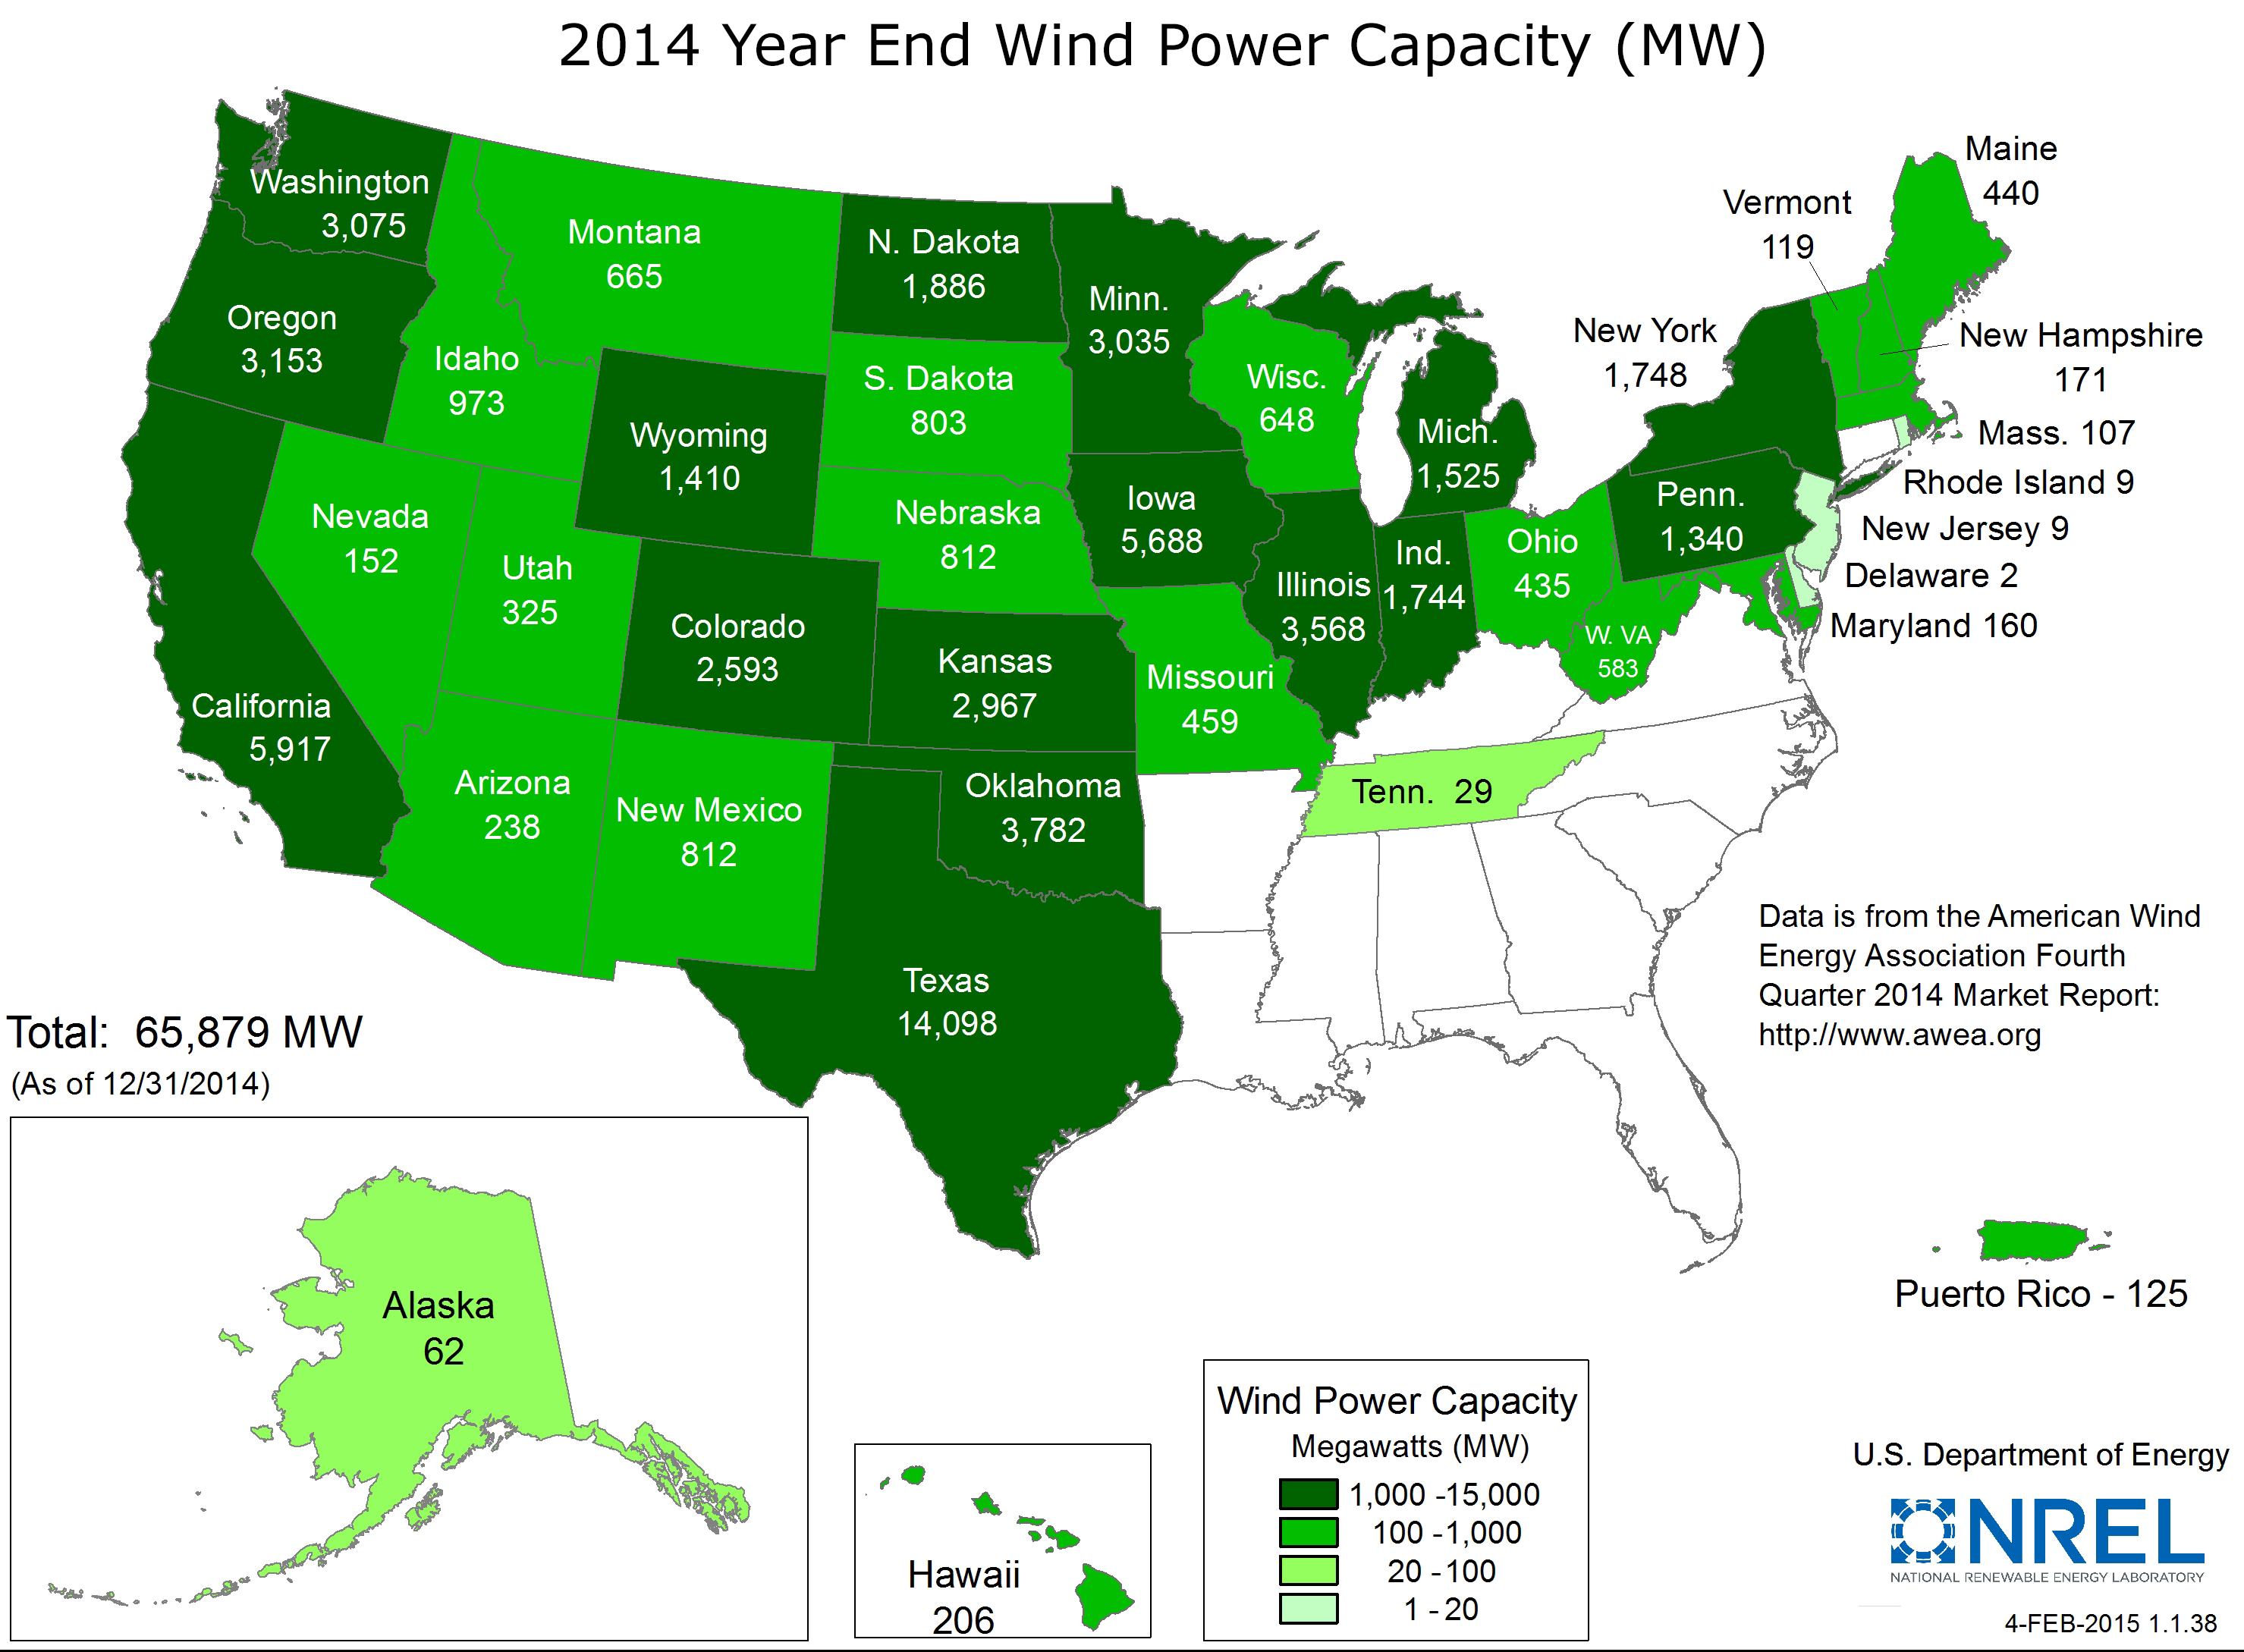
Figure 4. Current Installed Wind Power Capacity. [Click image for full size version.]
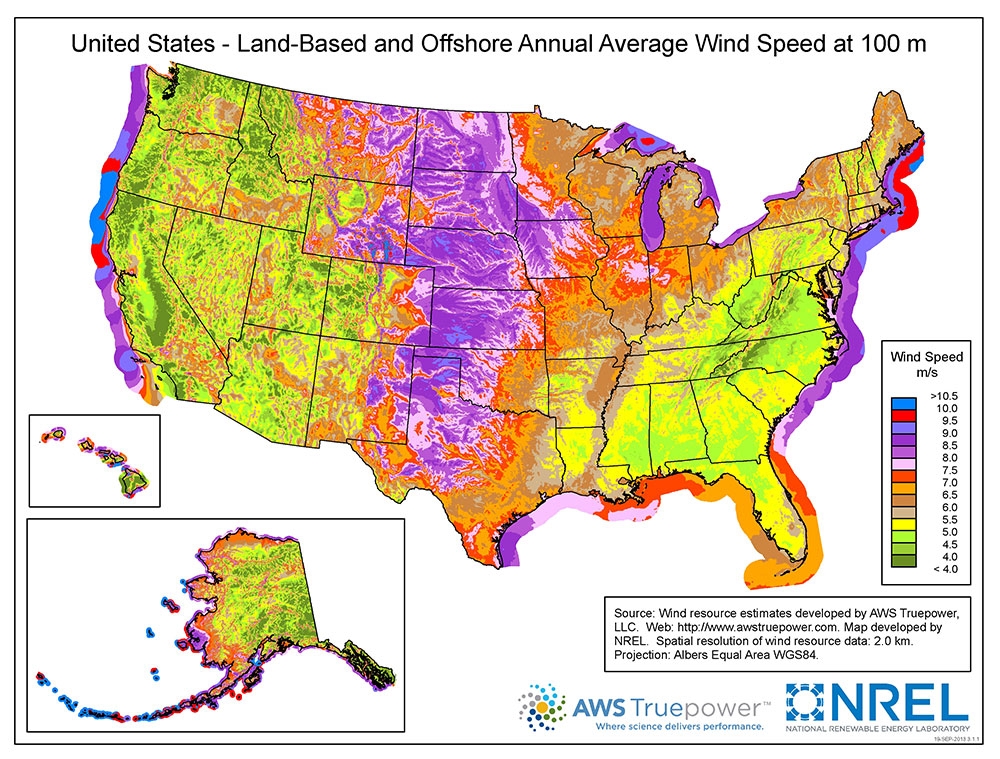
Figure 5. Land-Based and Offshore Annual Average Wind Speeds in the U.S. at 100 Meter Hub Height.
Concentrating on Florida and comparing different wind potential capacities at hub heights of 110 meters (361 feet) in Figure 6 with 140 meters (459 feet) in Figure 7, there are a substantially greater number of locations where land-based wind energy is estimated to be economically viable in the state at taller hub heights.[24], [25] These maps are generally based on a 35% gross capacity factor, which is the percentage of wind energy a single turbine can generate based on the observed wind conditions compared to the turbine’s maximum output under optimal wind conditions.[26]
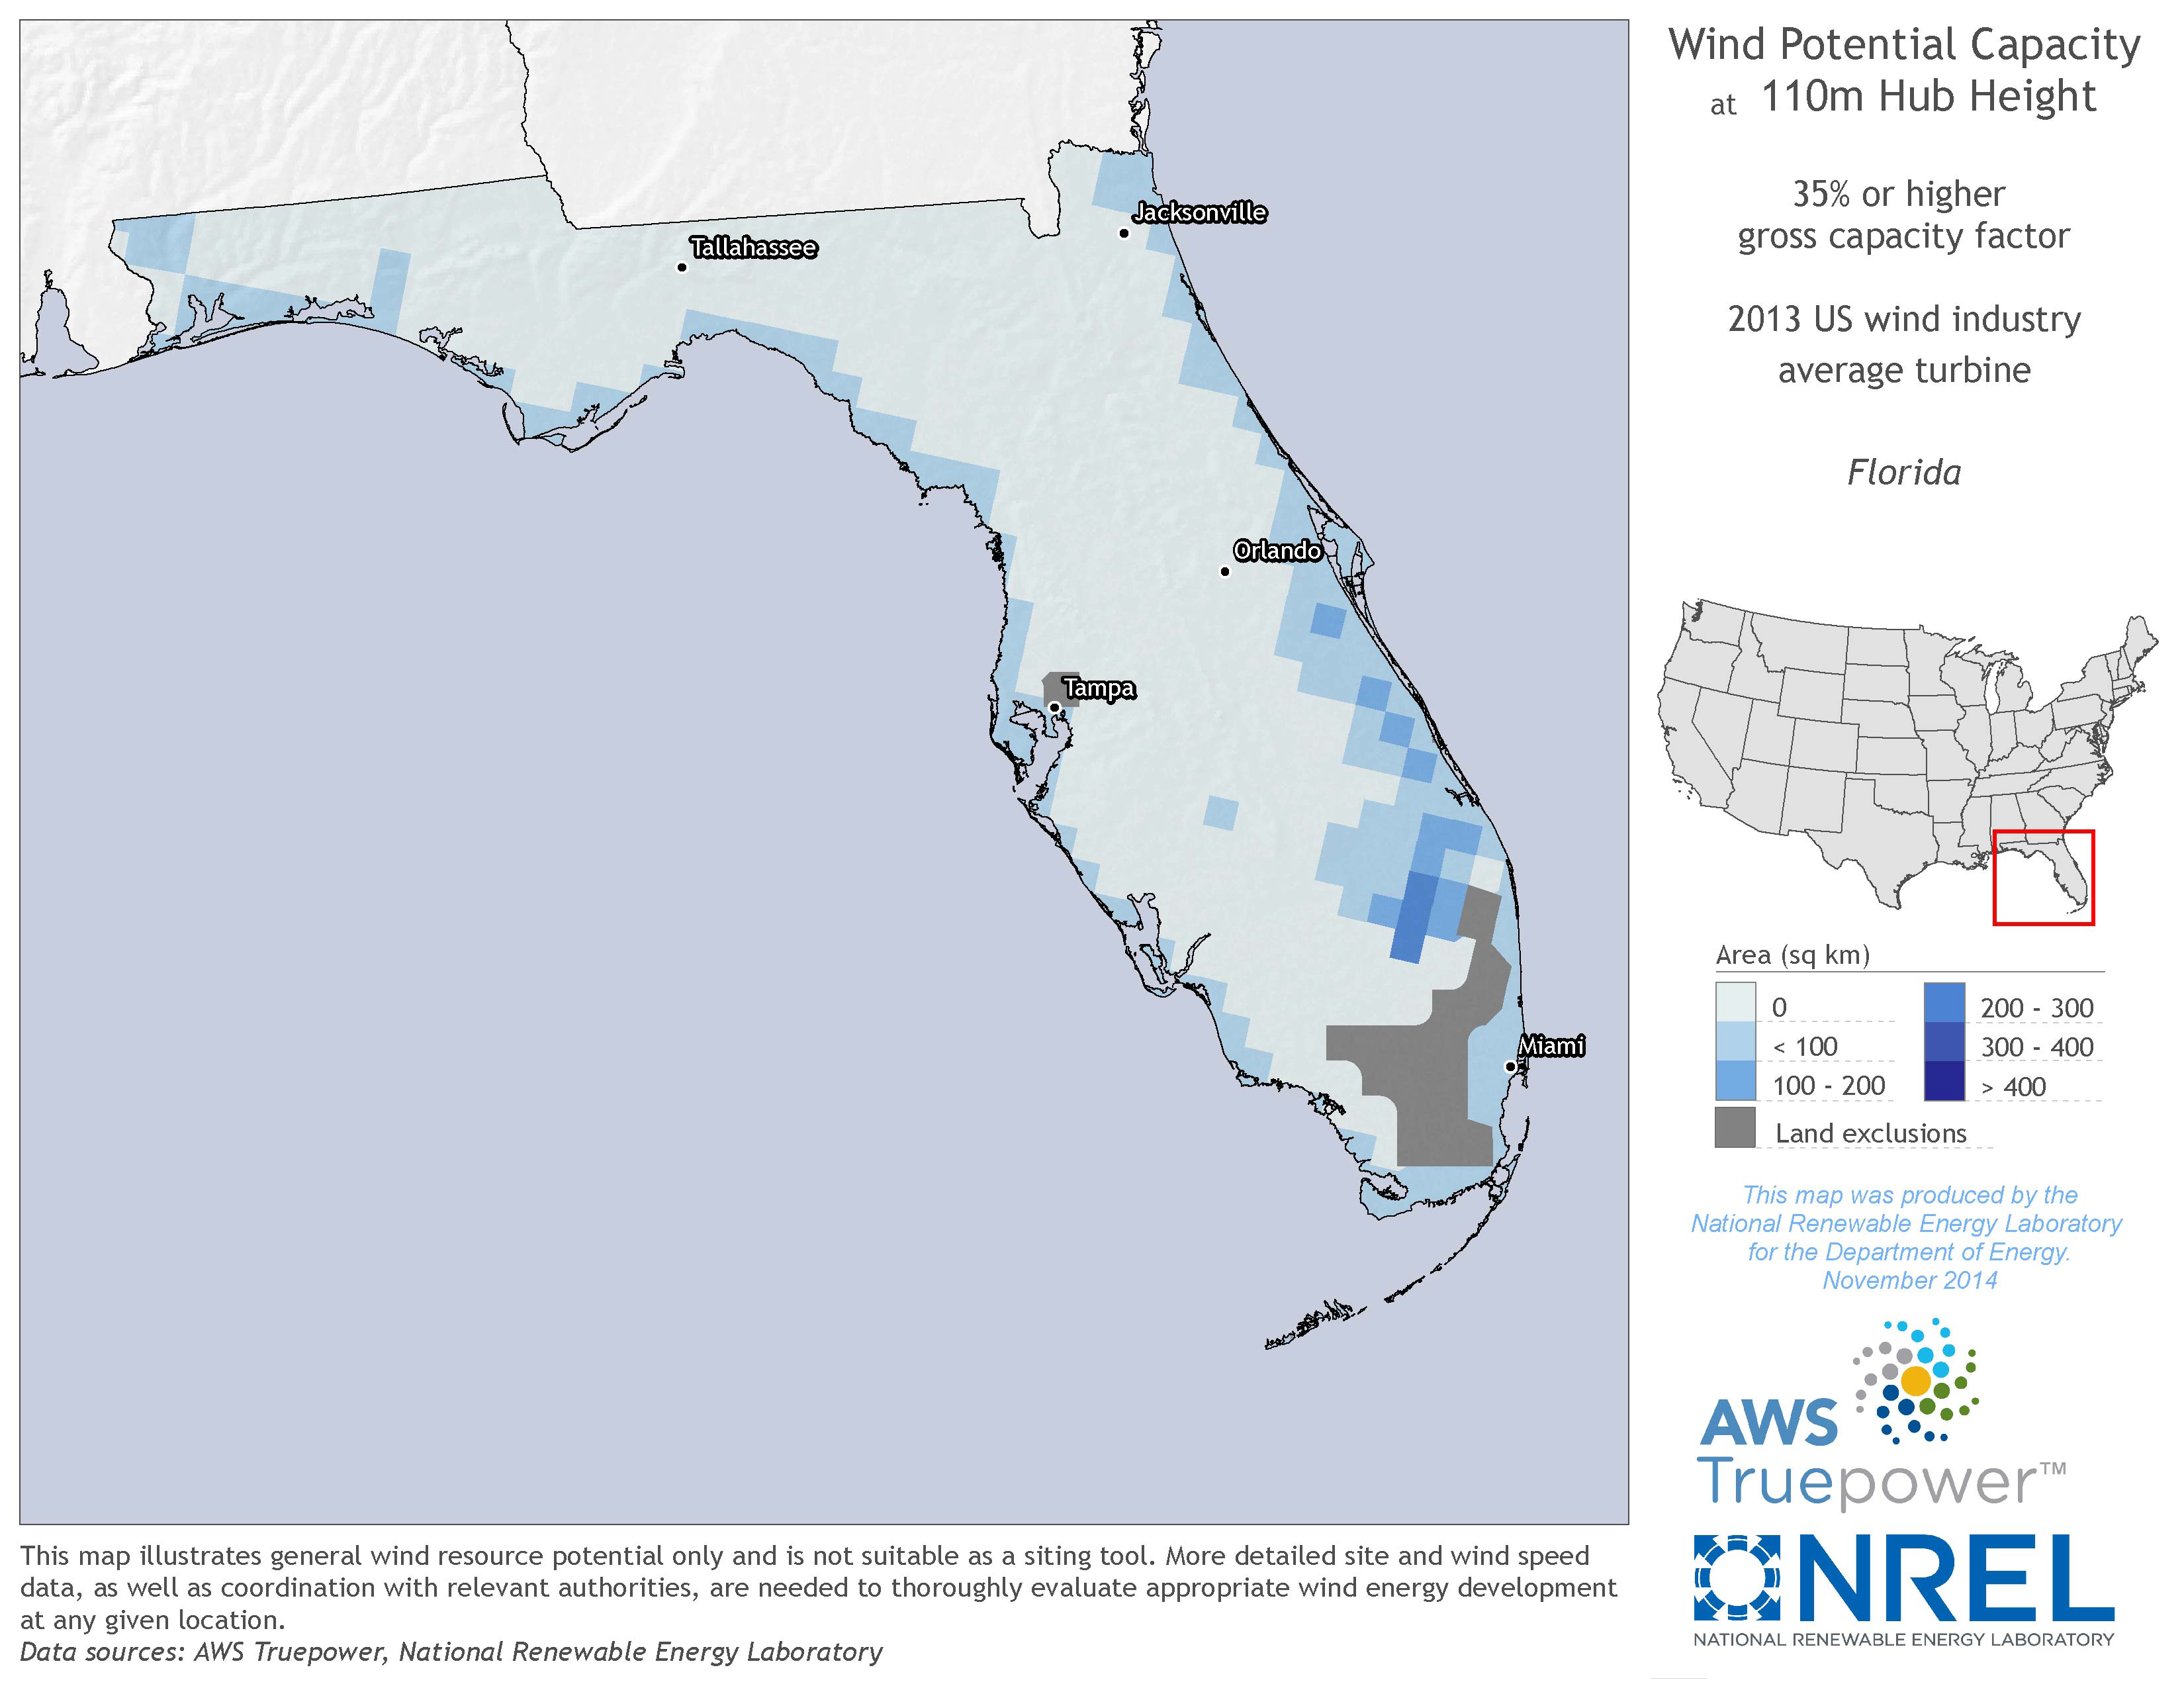
Figure 6. Florida Wind Potential Capacity at 110m Hub Height. [Click image for full size version.]
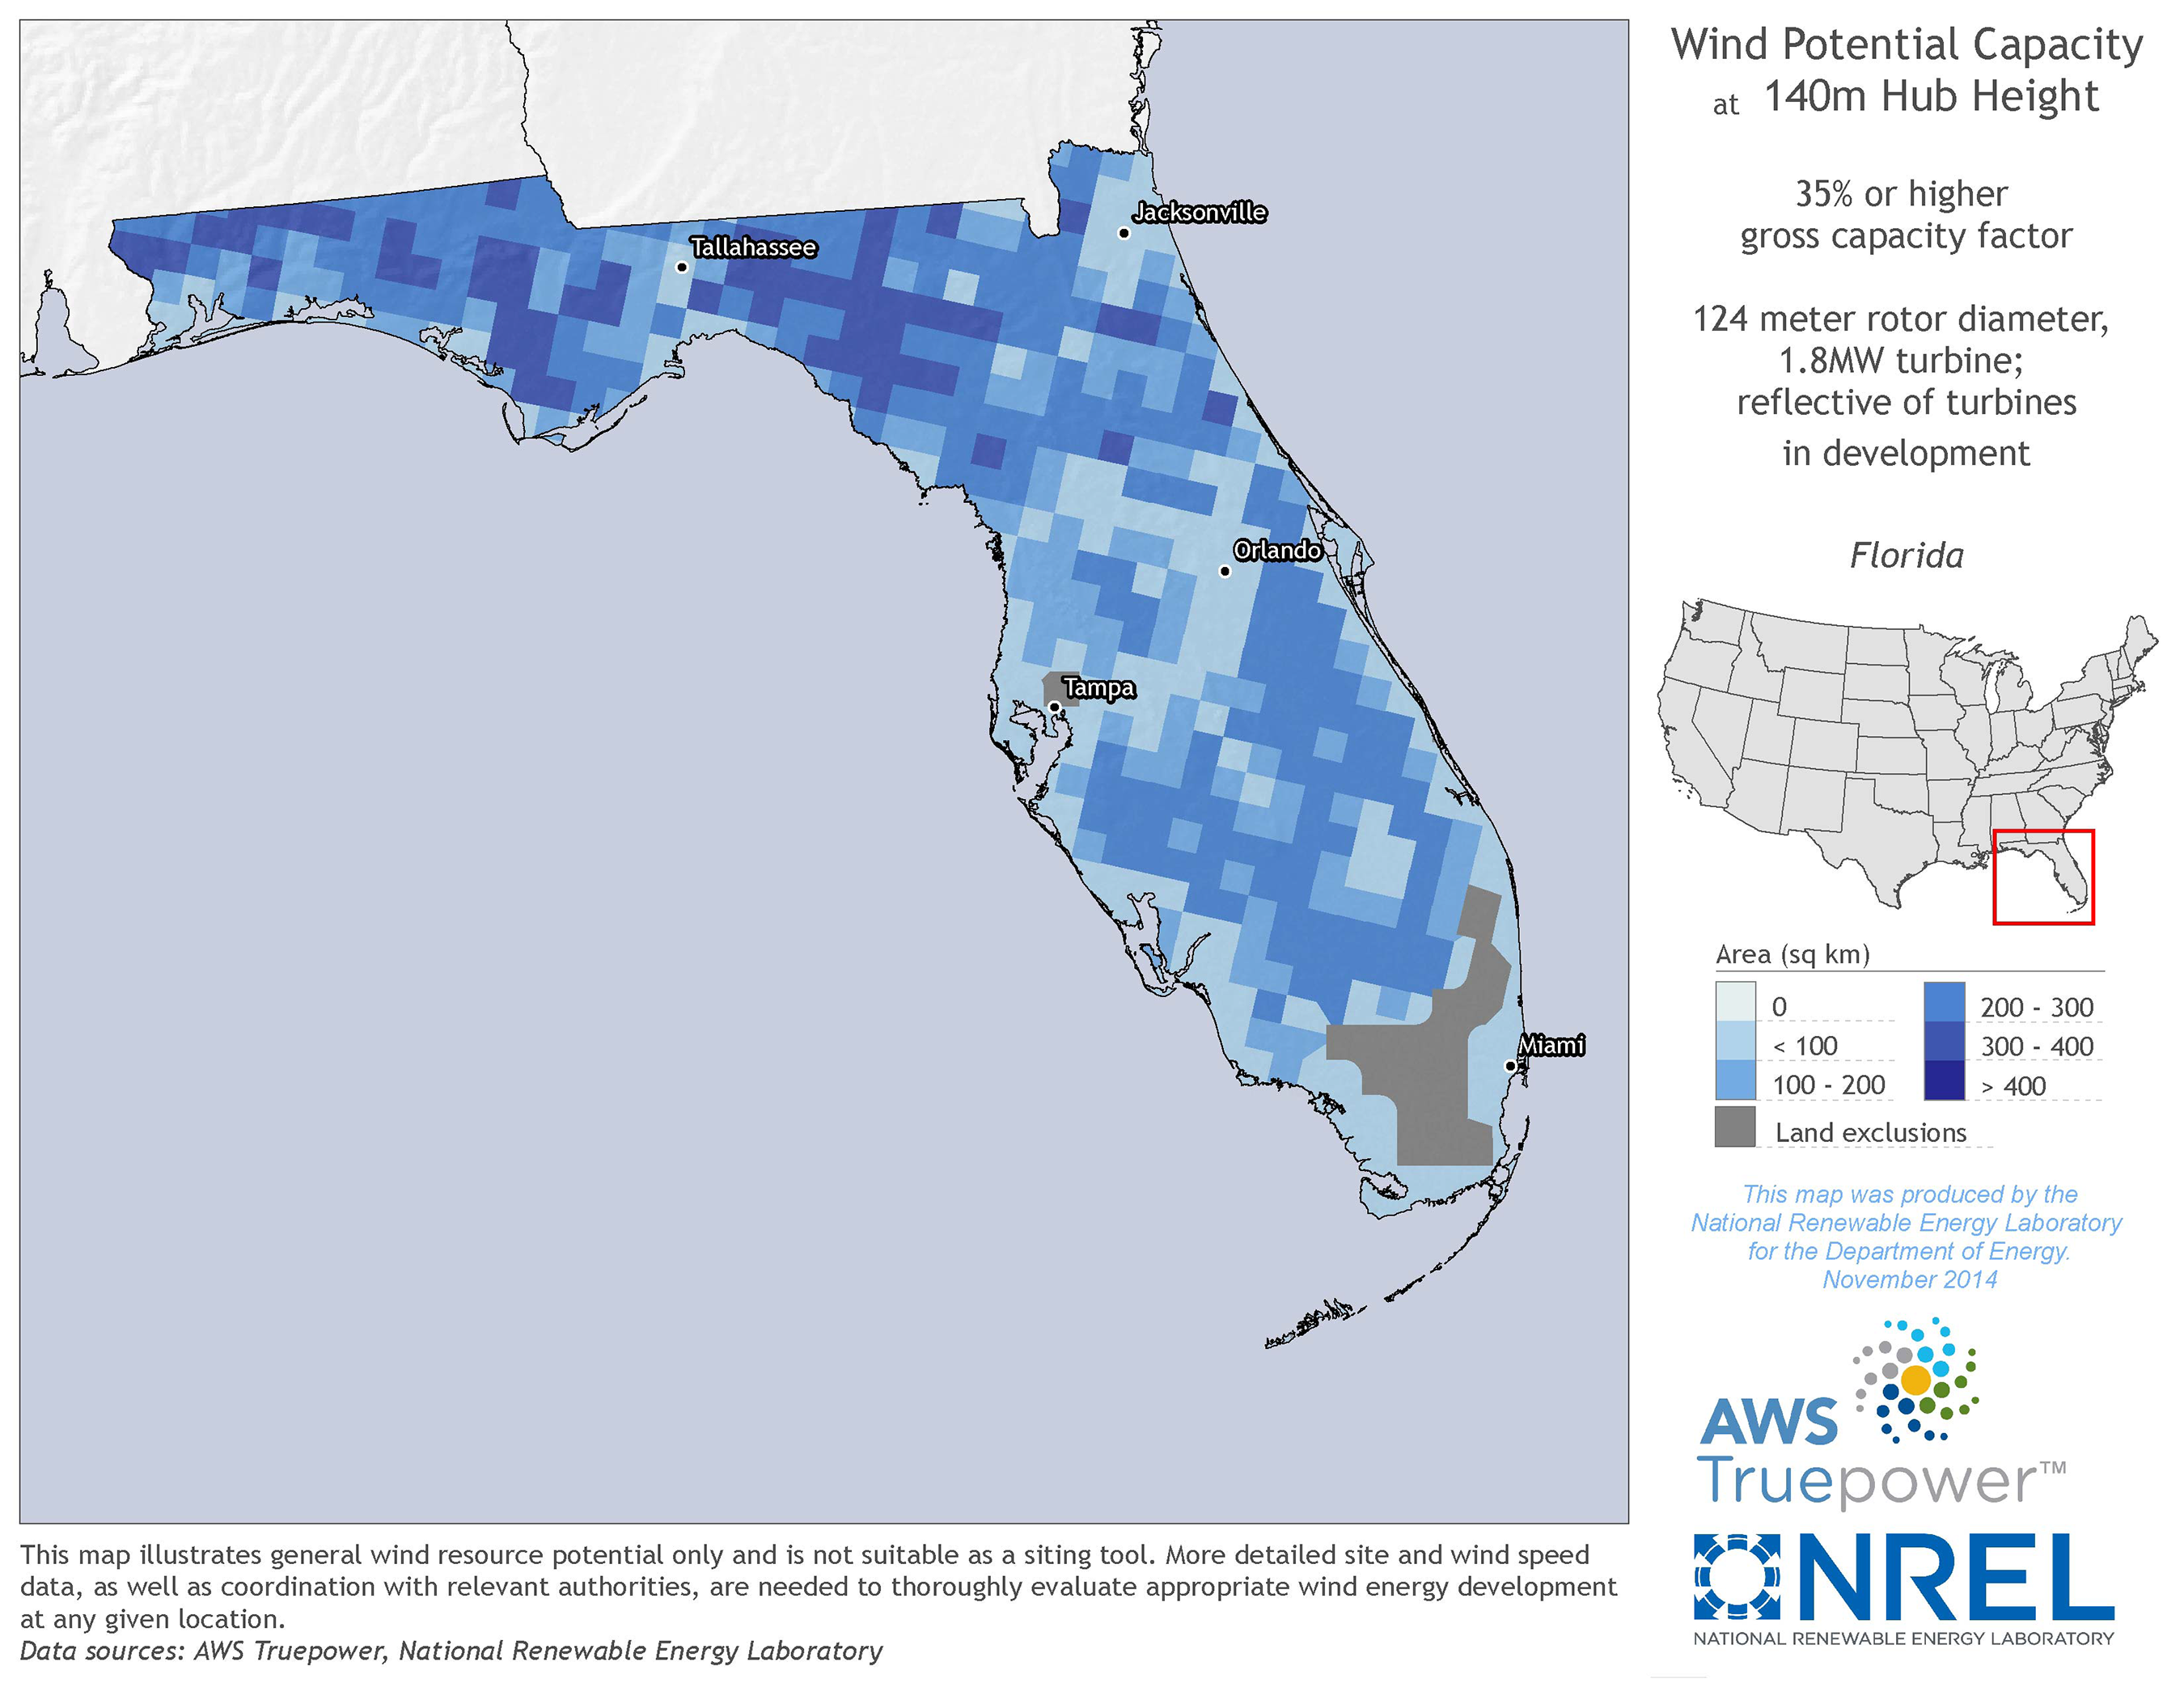
Figure 7. Florida Wind Potential Capacity at 140m Hub Height. [Click image for full size version.]
Wind duration is also an important factor that affects the wind potential capacity from one site to another. Imagine relying on wind energy to power your home from day to day, and the wind stops blowing for long periods of time. At most sites, wind duration is much more difficult to forecast over long periods of time, so electricity produced on site using wind energy goes directly to the power grid rather than being consumed or stored on site. This means that the electricity you use by pulling from the power grid comes indirectly not only from the power your wind system produced, but also from all of the other sources of electricity providing power to the grid.
Research is continuing to develop the means to store distributed power, once generated on site, for later use both on site and at the utility (power grid) level. For a better understanding of the current power produced from wind turbines across the nation, the United States Geological Survey (USGS) created a national data set and interactive mapping application that uses publicly available data on wind turbines.[27]
The business side of wind energy and Florida’s role
A wind energy industry already exists in Florida. The largest owner of wind power capacity in the U.S., NextEra Energy Resources (a Subsidiary of FP&L), is headquartered in Juno Beach; General Electric (GE) manufactures wind turbine generators in Pensacola; and Siemens, a world leader in offshore wind power, has its North American Wind Power headquarters in Orlando. Florida is also home to several smaller wind turbine component suppliers. Figure 8 shows the approximate locations of wind energy related manufacturing jobs in Florida.[28]
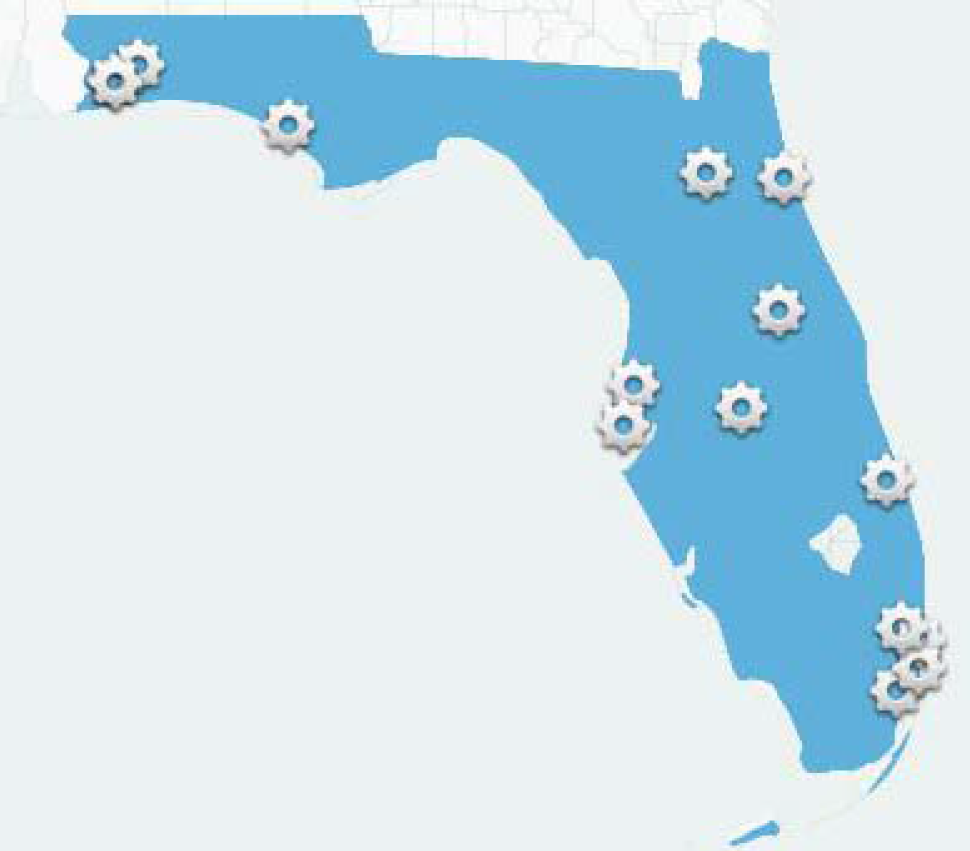
Figure 8. Location of Wind Energy-Related Manufacturing Jobs in Florida. [Click image for full size version.]
In addition, there are businesses developing and selling “small wind” (1–100 kW) turbines in the state. If you are interested in determining whether a “small wind” electric system can provide all or a portion of the energy you need for your home or business based on your wind resource, energy needs, and financial resources, check out the Small Wind Electric Systems: A Florida Consumer’s Guide. If looking for possible funding to install wind energy at your site or in your community, visit the Database of State Incentives for Renewables & Efficiency (DSIRE) website for a list of financial incentives available in Florida and links to the most current rules, regulations and policies. For career ideas within the field of wind energy, check out the Energy.gov website, Explore Careers in Wind Power.
What about offshore wind energy?
Offshore wind, considered to be a marine renewable resource, is not affected by the roughness of the land surface (topography, vegetation, buildings) and so presents an attractive potential to land-based systems. In addition, offshore winds are typically stronger and more stable than winds over land. Offshore wind farms are usually built in relatively shallow water, and Florida’s wide continental shelves and 1,197 miles of coastline present ample opportunities for siting wind farms outside of coastal view sheds.
Offshore wind turbines are a proven technology, with many countries having installed wind capacity by the end of 2013, including: China, Denmark, Finland, Germany, Ireland, Japan, Korea, the Netherlands, Norway, Portugal and the United Kingdom.[29] In 2013, fourteen offshore wind projects were in various stages of development within the U.S.[30] Figure 9 maps U.S. advanced-stage proposed offshore wind energy projects by jurisdiction and project size in 2013, with most located in the northeast.[31] A 2015 report by Oceana, an ocean conservation organization, estimates that a modest and gradual development of offshore wind on the East Coast of the U.S. could generate up to 143 GW of power over the next 20 years, which is enough to power over 115 million households.[32] In addition they estimate that, during the same period of time, offshore wind along the East Coast could create approximately 91,000 more jobs than offshore drilling in the same area.
![Figure 9. Proposed U.S. Offshore Wind Energy Projects in Advanced Development Stages by Jurisdiction and Project Size. [Click image for full size version.]](http://www.myfloridahomeenergy.com/wp-content/uploads/2015/06/Navigant-report-map-only-cropped.png)
Figure 9. Proposed U.S. Offshore Wind Energy Projects in Advanced Development Stages by Jurisdiction and Project Size. [Click image for full size version.]
The Center for Ocean-Atmospheric Prediction Studies (COAPS) specializes in atmospheric modeling, seasonal and longer-term climate studies, hurricane risk assessment, and marine weather (satellite and surface) observation.[33] COAPS and the Institute for Energy Systems, Economics, and Sustainability (IESES) at Florida State University conducted a pilot study of wind resources at select towers and buoys in Florida’s waters. They found that the northwestern Gulf of Mexico has the potential to generate several thousand megawatts of offshore wind power for Floridians.[34] Note that additional research is needed related to this potential as most of the offshore wind measurements in the Gulf of Mexico and Florida’s Atlantic coast were from widely scattered buoy and coastal platforms with wind measurement heights at 5–10 m (~16 to 33 feet) with a few at 30–40 m (~98 to 131 feet), well below the heights of modern offshore wind turbines.
A systematic and thorough evaluation of Florida’s wind resource is critical to identify the best opportunities for investing in the state’s offshore wind energy resources. Georgia is already ahead of Florida in this regard, with the Georgia Institute of Technology investigating offshore wind energy potential with offshore measurement towers supported by the Southern Company. A comprehensive wind resource assessment would incorporate remote sensing (e.g. Doppler Lidar to get near the 100 m level of wind turbines), marine wind measurements from tall towers, coupled ocean-atmosphere modeling techniques, and detailed flow models.
With the possible emergence of a national or state renewable energy portfolio standard, offshore wind energy will be needed to help utilities operating in southeastern states to make their annual renewable quotas. If Florida requires utilities to purchase locally-generated renewables, economists will need to evaluate the relative costs of wind, solar, biomass, and other renewable sources under different investment and implementation scenarios. For example, if Florida allows importing electricity generated from renewables from nearby states, the costs of added transmission infrastructure and lost economic development will need to be weighed against the benefits of non-local renewables.
A look to the future
From wind turbines installed on the roof of the Ft. Lauderdale Hilton hotel (Figure 10)[35] to wind trees using micro-turbine leaves to generate electricity, human ingenuity and creativity combined with sound research continues to keep us moving in the direction of using renewable resources more and more for our power generation. Research is a necessary and important part of this trend. For instance, with access to better weather forecasts, wind energy plant operators and industry professionals can ensure wind turbines operate closer to maximum capacity, leading to lower energy costs for producers and consumers. Since tropical cyclones are a risk factor to wind energy infrastructure, advanced hurricane risk modeling will be needed to help specify wind turbine engineering design factors related to wind loading. See Long-Term Research and Development Needs for Wind Energy (for the time frame 2012 to 2030) for more information regarding on-going research topics.[36]
In a November 2014 report from the Florida Public Service Commission, Florida’s electrical utilities do not expect wind energy to be a major contributor to electrical generation in the near future. However, they do envision expanded renewable energy capacity to increase by 722 MW over the next ten years. See their full report for more details.
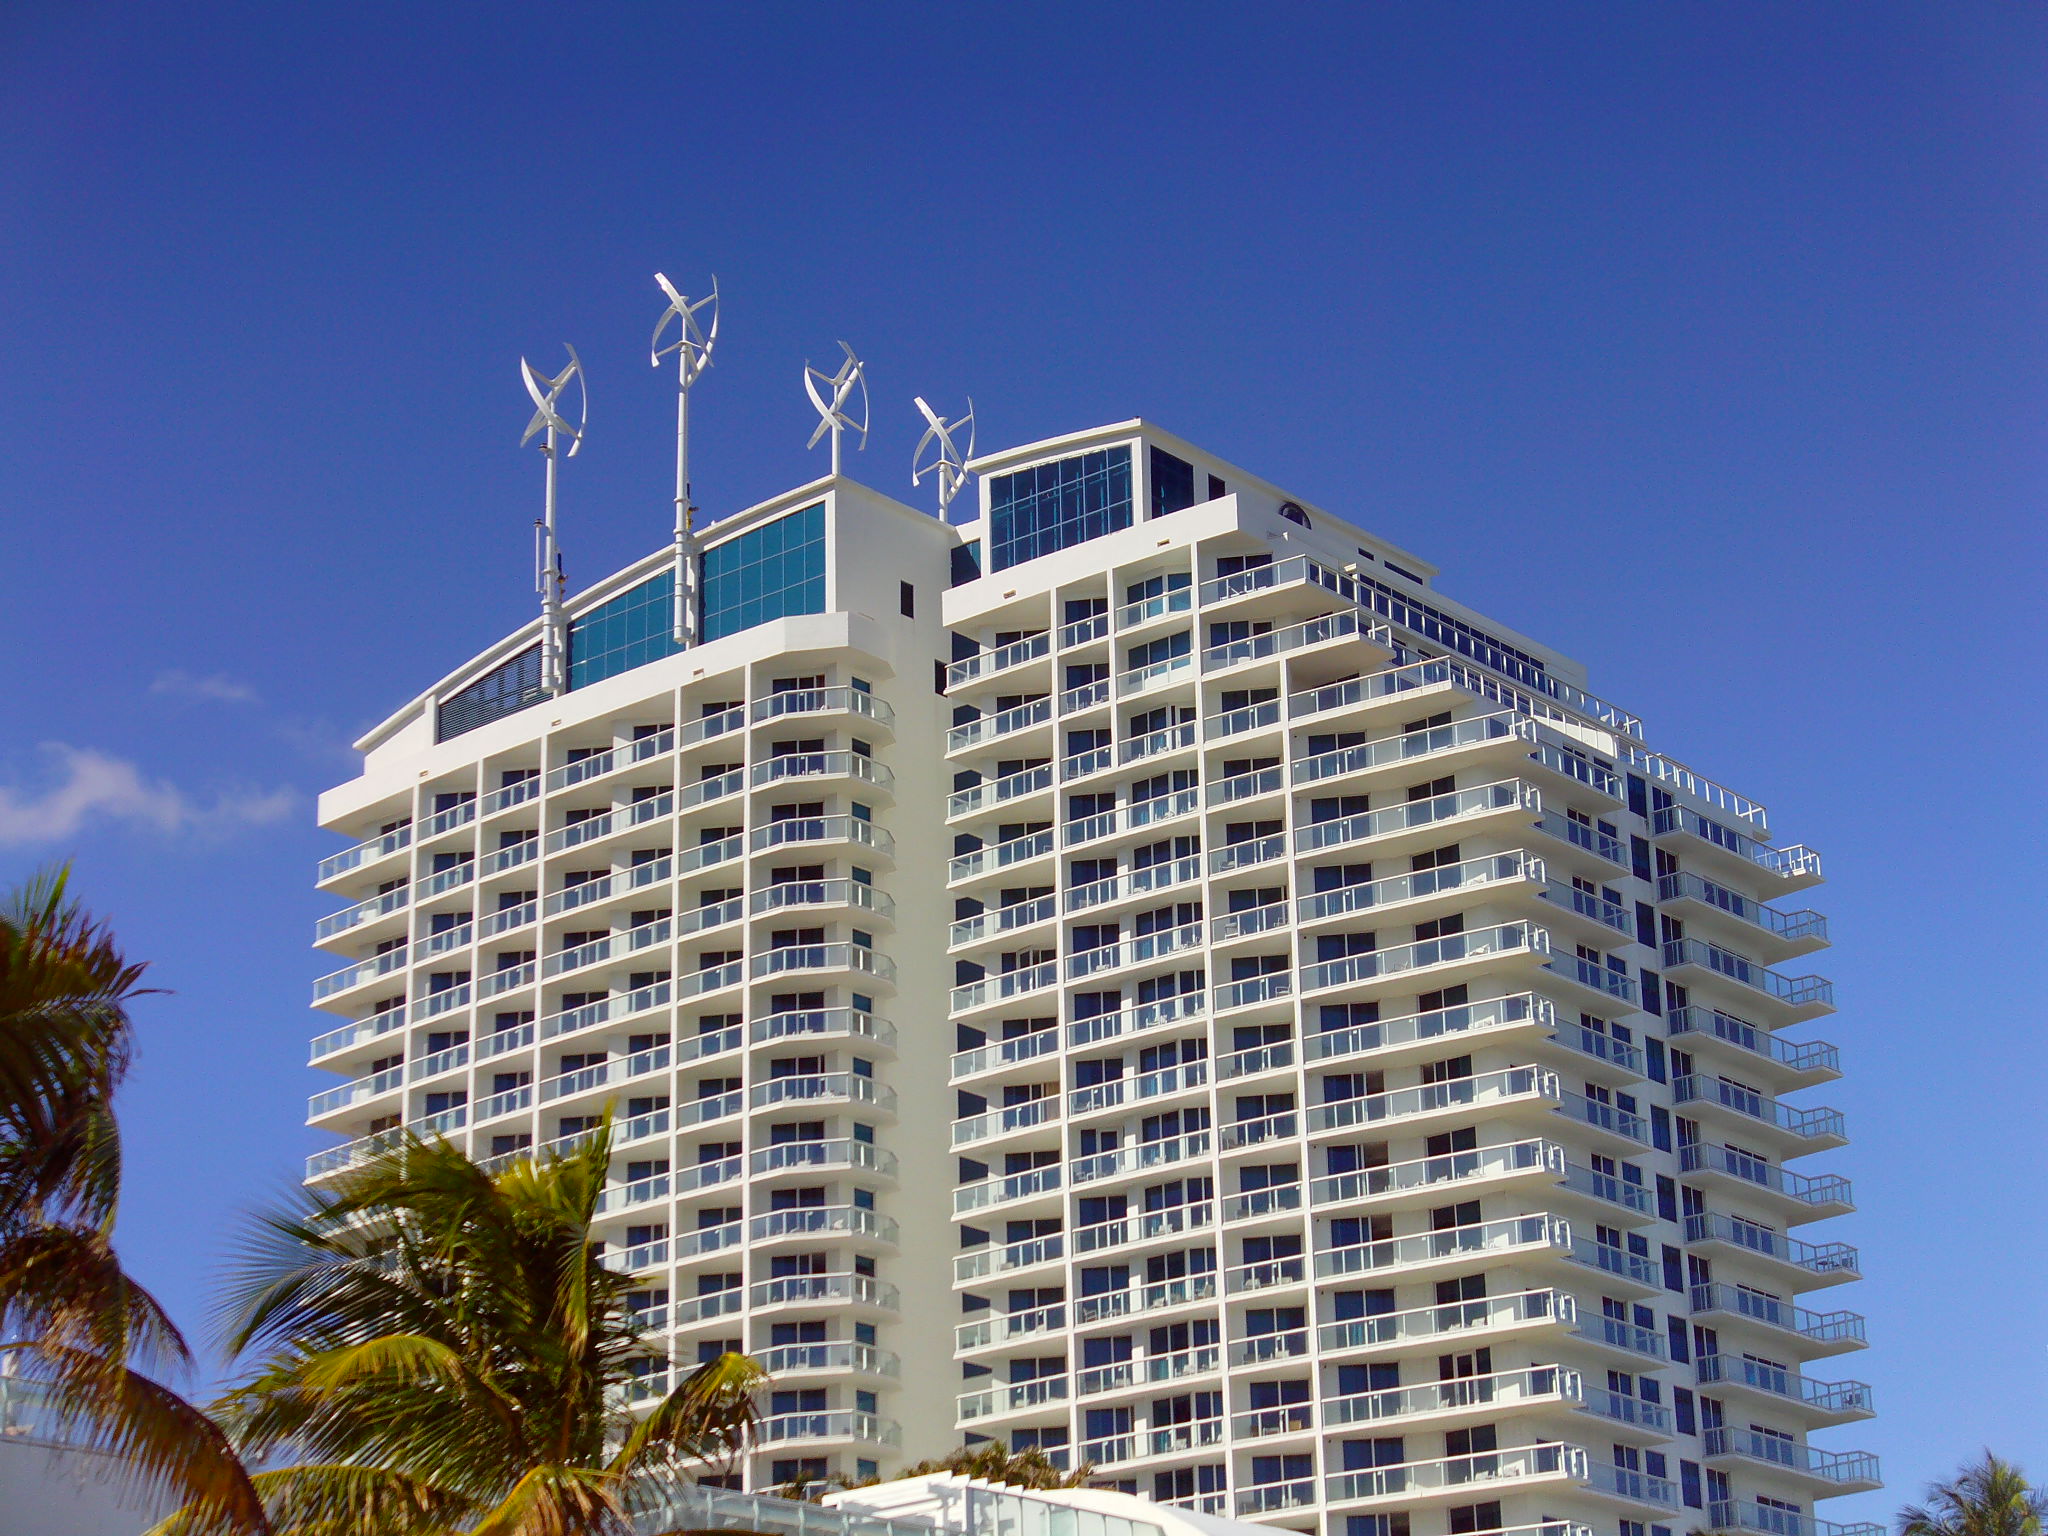
Figure 10. Wind Turbines Atop the Hilton. [Click image for full size version.]
The Florida Energy Systems Consortium (FESC) is part of the U.S. Department of Energy’s recently established six wind energy regional resource centers (RRCs) across the nation that have the goal to expand wind energy in each region.[37] The centers will develop information about the challenges facing wind energy deployments and work with decision makers to ensure they have the tools to make informed decisions about wind energy projects and related policies in their jurisdictions. The FESC team will provide fact-based Florida wind information to local and state decision makers, engage with stakeholders and military bases to provide information on wind energy, and collaborate with RRC network members and connect key stakeholders to the network.
Interested in learning more about wind energy?
- Watch the video A New Vision for United States Wind Power, which reports preliminary findings of the benefits, challenges and realities of wind energy for the next 30+ years in the U.S.
- Check out the WINDExchange, which is the U.S. DOE Wind Program’s website that includes information for stakeholders, individuals and communities. Subscribe to their electronic newsletter.
- Subscribe to DOE’s Wind Program Breaking News (newsletter).
- Visit the American Wind Energy Association’s (AWEA), the national trade association for the U.S. wind industry, website.
- There are a number of misperceptions and myths about wind energy, such as the myth that wind power is relatively expensive and unreliable. One document, Wind Energy Myths from the U.S. Department of Energy’s Energy Efficiency and Renewable Energy office, addresses some of the most common myths and clarifies them.[38] A more recent website page, Environmental Impacts and Siting of Wind Projects, provides more information and links to recent research on the topic.
Acknowledgements
Coordinating Editors: Kathleen C. Rupperta and Jennison K. Searcya
Reviewers: Arindam Gan Chowdhuryb and David O. Prevattc
a Program for Resource Efficient Communities, Florida Cooperative Extension Service, Institute of Food and Agricultural Sciences, University of Florida, Gainesville, FL.
b Laboratory for Wind Engineering Research, Department of Civil and Environmental Engineering, Florida International University, Miami, FL.
c School of Sustainable Infrastructure and Environment, Department of Civil and Coastal Engineering, University of Florida, Gainesville, FL.
First published March 2015.
This is a fact sheet in the Carbon Challenge Series for the Florida Energy Systems Consortium (FESC). The goal of the consortium is to become a world leader in energy research, education, technology, and energy systems analysis. For more information, go to the FESC website.
Footnotes
[1] U.S. Department of Energy, Office of Energy Efficiency & Renewable Energy. (n.d.). How Do Wind Turbines Work? Last accessed March 11, 2015.
[2] IEA Wind. (2013). Long-Term Research and Development Needs for Wind Energy for the Time Frame 2012 to 2030. Last accessed March 11, 2015.
[3] U.S. Department of Energy, Office of Energy Efficiency and Renewable Energy. (2014). 2013 Renewable Energy Data Book (No. DOE/GO-102014-4491). Last accessed March 11, 2015.
[4] Ibid.
[5] Ibid.
[6] Ibid.
[7] U.S. Department of Energy, Office of Energy Efficiency & Renewable Energy. (n.d.). History of Wind Energy. Last accessed March 11, 2015.
[8] U.S. Department of Energy, Energy Efficiency and Renewable Energy. (n.d.). Wind Program. Last accessed March 11, 2015.
[9] IEA Wind. (2013). IEA Wind 2013 Annual Report Executive Summary. Last accessed March 11, 2015.
[10] U.S. Department of Energy, Office of Energy Efficiency and Renewable Energy. (2014). 2013 Renewable Energy Data Book (No. DOE/GO-102014-4491). Last accessed March 11, 2015.
[11] Zayas, J. (2014, May). Department of Energy Wind Vision: An Industry Preview. Last accessed March 11, 2015.
[12] U.S. Department of Energy, Office of Energy Efficiency and Renewable Energy. (2014). 2013 Renewable Energy Data Book (No. DOE/GO-102014-4491). Last accessed March 11, 2015.
[13] Zayas, J. (2014, May). Department of Energy Wind Vision: An Industry Preview. Last accessed March 11, 2015.
[14] Ibid.
[15] Global Wind Energy Council. (n.d.). Wind in Numbers. Last accessed March 11, 2015.
[16] U.S. Department of Energy, Office of Energy Efficiency & Renewable Energy. (n.d.). The Inside of a Wind Turbine. Last accessed March 11, 2015.
[17] U.S. Department of Energy, Office of Energy Efficiency and Renewable Energy. (2014). 2013 Renewable Energy Data Book (No. DOE/GO-102014-4491). Last accessed March 11, 2015.
[18] HINT.FM. (n.d.). Wind Map. Last accessed March 11, 2015.
[19] Ivo. (n.d.). Windyty Wind Map & Forecast. Last accessed March 11, 2015.
[20] U.S. Department of Energy, Office of Energy Efficiency & Renewable Energy. (n.d.). WINDExchange: Utility-Scale Land-Based 80-Meter Wind Maps. Last accessed March 11, 2015.
[21] Wiser, R., Yang, Z., Hand, M., Hohmeyer, O., Infield, D., Jensen, P. H., et al. (2011). Wind Energy. In IPCC Special Report on Renewable Energy Sources and Climate Change Mitigation (pp. 535–608). Cambridge, UK and New York NY, USA: Cambridge University Press. Last accessed March 11, 2015.
[22] U.S. Department of Energy, Office of Energy Efficiency & Renewable Energy. (n.d.). WINDExchange: U.S. Installed Wind Capacity. Last accessed March 11, 2015.
[23] U.S. Department of Energy, Office of Energy Efficiency & Renewable Energy. (n.d.). Wind Resource Assessment and Characterization. Last accessed March 11, 2015.
[24] Ibid.
[25] U.S. Department of Energy, Office of Energy Efficiency & Renewable Energy. (n.d.). WINDExchange: Florida Wind Resource Map and Potential Wind Capacity. Last accessed March 11, 2015.
[26] Ibid.
[27] Demas, A. (2014, February 11). Mapping the Nation’s Wind Turbines. United States Geological Survey: Science Features.
[28] American Wind Energy Association (AWEA). (n.d.). Florida Wind Energy. Last accessed March 11, 2015.
[29] IEA Wind. (2013). IEA Wind 2013 Annual Report Executive Summary. Last accessed March 11, 2015.
[30] Ibid.
[31] Hahn, M., & Gilman, P. (2014). Offshore Wind Market and Economic Analysis. 2014 Annual Market Assessment. No. DE-EE0005360). U.S. Department of Energy. Last accessed March 11, 2015.
[32] Menaquale, A. (2015, January). Offshore Energy by the Numbers: An Economic Analysis of Offshore Drilling and Wind Energy in the Atlantic. Oceana. Last accessed March 11, 2015.
[33] Smith, S., Powell, M., Cocke, S., & Collier, C. (2013, March). The Power of Wind: Investigations into the Viability of Harnessing Offshore Wind Energy for Florida. Center for Ocean-Atmospheric Prediction Studies. Last accessed March 11, 2015.
[34] Florida Energy Systems Consortium. (2014). Annual Report, October 1, 2013 – September 30, 2014. Last accessed March 11, 2015.
[35] Wind turbines mounted on the roof of the Hilton. Last accessed March 11, 2015.
[36] IEA Wind. (2013). Long-Term Research and Development Needs for Wind Energy for the Time Frame 2012 to 2030. Last accessed March 11, 2015.
[37] Balaban, J. (2014, August). Wind Initiatives. Presented at the FESC Stakeholders Meeting, Juno Beach, FL. Last accessed March 11, 2015.
[38] U.S. Department of Energy, Office of Energy Efficiency & Renewable Energy. (2005). Wind Energy Myths. Wind Powering American Fact Sheet Series. (No. DOE/GO-102005-2137). Last accessed March 11, 2015.